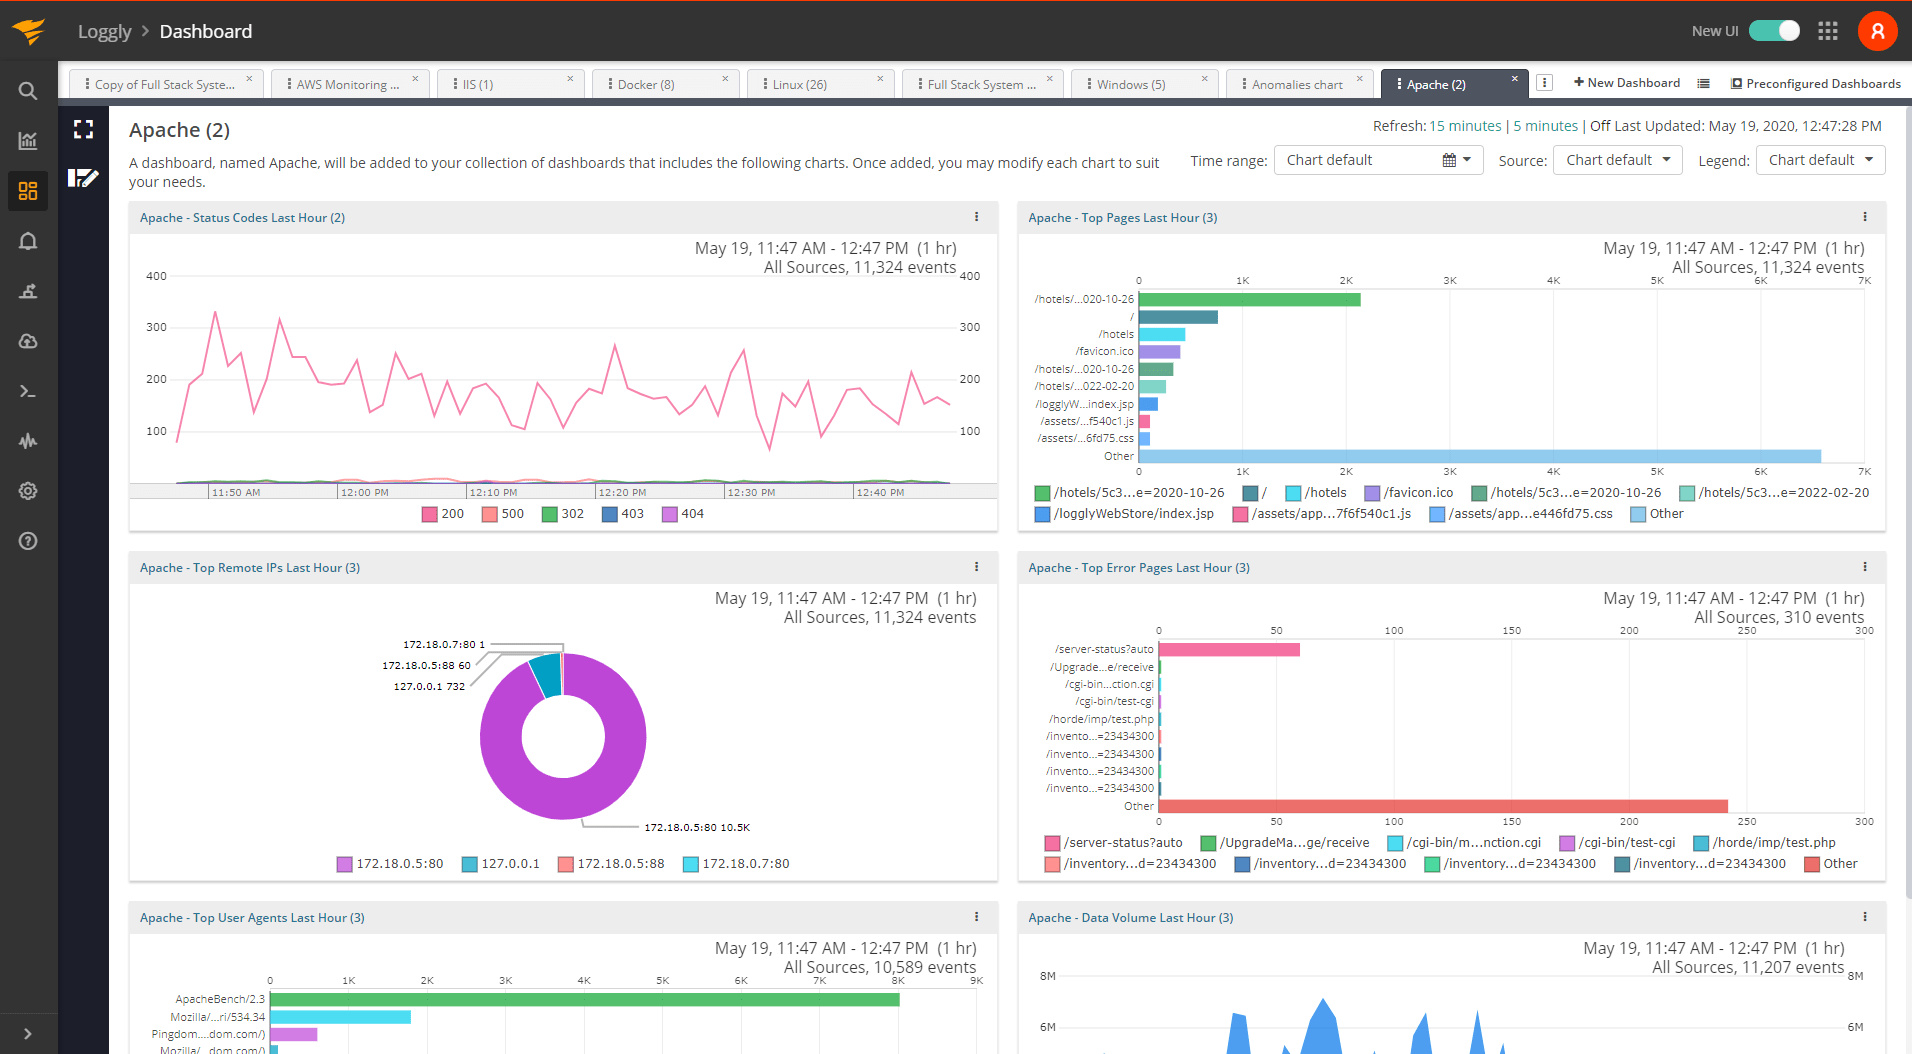
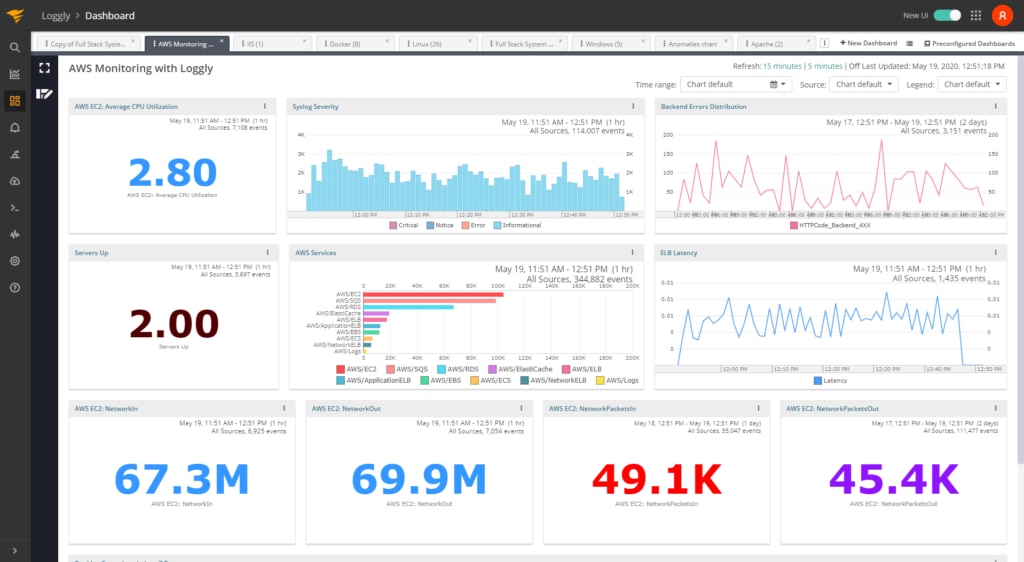
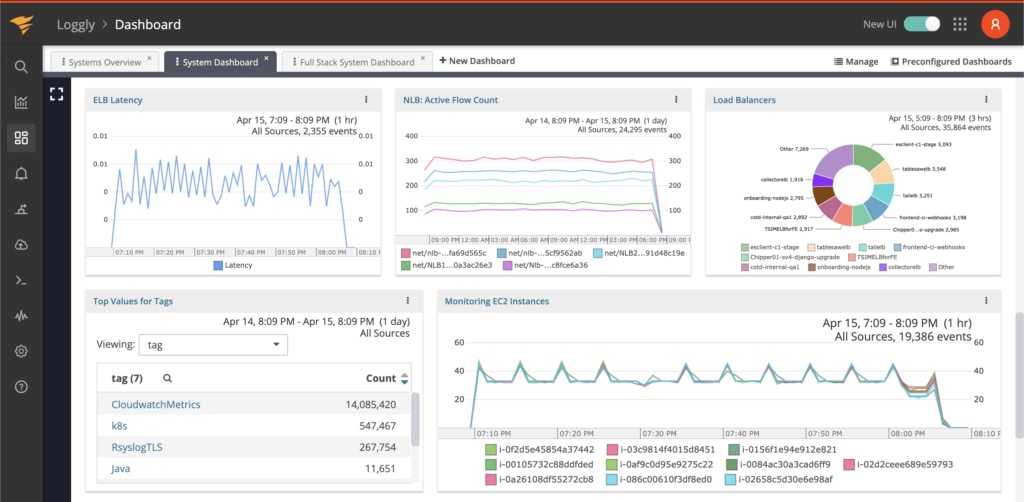
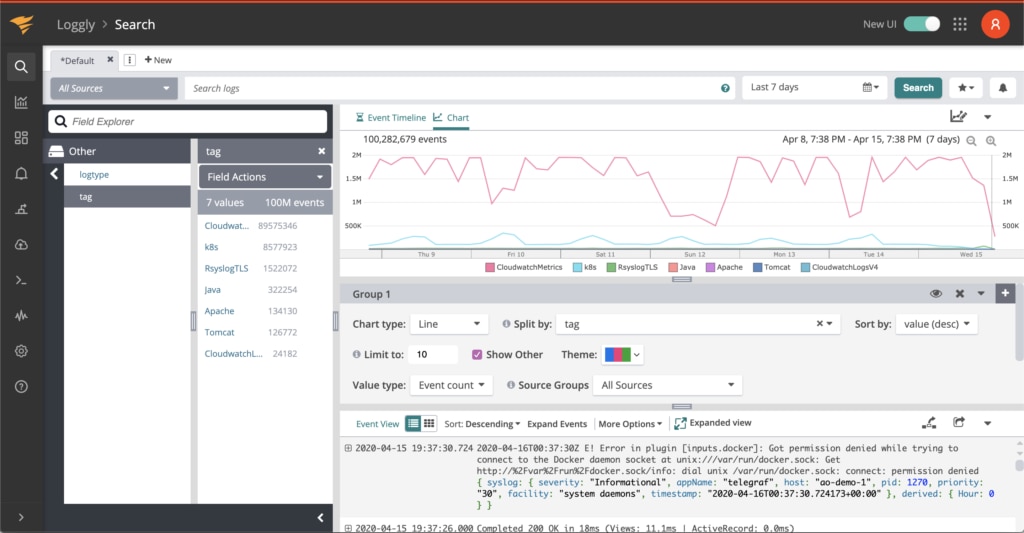
Synthetic Monitoring

Simulate visitor interaction with your site to monitor the end user experience.

View Product Info

FEATURES

Simulate visitor interaction

Identify bottlenecks and speed up your website.

Learn More

Real User Monitoring

Enhance your site performance with data from actual site visitors

View Product Info

FEATURES

Real user insights in real time

Know how your site or web app is performing with real user insights

Learn More

Infrastructure Monitoring Powered by SolarWinds AppOptics

Instant visibility into servers, virtual hosts, and containerized environments

View Infrastructure Monitoring Info
Comprehensive set of turnkey infrastructure integrations

Including dozens of AWS and Azure services, container orchestrations like Docker and Kubernetes, and more 

Learn More

Application Performance Monitoring Powered by SolarWinds AppOptics

Comprehensive, full-stack visibility, and troubleshooting

View Application Performance Monitoring Info
Complete visibility into application issues

Pinpoint the root cause down to a poor-performing line of code

Learn More

Log Management and Analytics Powered by SolarWinds Loggly

Integrated, cost-effective, hosted, and scalable full-stack, multi-source log management

 View Log Management and Analytics Info
Collect, search, and analyze log data

Quickly jump into the relevant logs to accelerate troubleshooting

Learn More

Log Monitoring

Tracking and analyzing logs is crucial to ensure the availability of applications and servers for end users. Together, SolarWinds® Loggly®, SolarWinds Pingdom®, and SolarWinds AppOptics allow you to efficiently monitor logs, applications, and infrastructure.

Proactive-Monitoring-Screenshot

Log Aggregation

Loggly aggregates logs from multiple sources into a centralized log management solution. The tool simplifies log management, giving you one place to manage access rights and apply retention policies. With a highly performant cloud architecture, Loggly easily scales to handle unpredictable spikes in log volume, helping ensure critical log data is never lost. Loggly is designed to process large volumes of data to enable you to quickly search across large and complex environments to see interconnected services, events, and issues.

Log Monitoring

Loggly offers continuous and proactive monitoring for application and infrastructure logs. Loggly learns the normal patterns in your log data and shows deviations so you can dis­cover unexpected or suspicious events before they turn into problems. Create alerts based on search patterns, thresholds for specific log metrics, or other conditions.

Log Analysis

Loggly summarizes log data as it’s received and provides immediate insights, and clickable log elements allow teams to quickly drill down into relevant log data. The surround search feature displays events in context across all aggregated logs to help pinpoint bottlenecks and failure points. Loggly also offers prebuilt dashboards and makes it easy to build custom dashboards to monitor application health, behavior, and trends. Quickly turn log dashboards into elaborate reports and share them with stakeholders via email or a collaboration system like Slack.

Loggly and Pingdom: A Complete Monitoring Solution

Together, Loggly and Pingdom provide comprehensive monitoring capabilities. Loggly provides log aggregation, monitoring, and analysis features to help detect application and infrastructure issues, and Pingdom simulates end-user interactions to identify the specific components causing delays in services.

  • Enhanced Monitoring: Together, these tools help in the identification of application errors and downtime. With their advanced functionalities—such as a log analyzer and real user monitoring (RUM)—teams can detect real-time issues, analyze metrics, simulate user interactions, and reduce MTTR.
  • Faster Troubleshooting: Loggly provides a unified view of logs in a consolidated format for quick analysis, and Pingdom allows you to monitor applications from any geographic location with over 100 servers. The combined capabilities of both tools help analyze application performance better and troubleshoot issues faster.

Loggly and Pingdom: How to Use Them Together

Development teams can use Loggly and Pingdom together in a comprehensive application performance management (APM) suite. These tools provide complex data visualizations in collaborative dashboards for proactive application monitoring.

Both tools generate detailed reports to track and monitor application logs, uptime, and end-user experience. The combined capabilities allow development and operational teams to detect application and system errors in real time from multiple geographic locations. This helps improve the overall visitor experience.

Try for Free

Deliver an uninterrupted end-user experience using the simulation and monitoring capabilities of Loggly and Pingdom. Monitor your server, application, and infrastructure logs in real time to ensure smooth business operations. Both tools offer free trials to help teams evaluate and assess their extensive features and functionalities.

Incorporate AppOptics for Added Functionality

AppOptics is a robust application and infrastructure monitoring solution designed to provide continuous visibility into critical systems, such as applications, servers, and infrastructure. It performs distributed tracing, live code profiling, and exception tracking to drill down into logs and find out the root cause of issues. When used with Loggly and Pingdom, AppOptics combines metrics, traces, and logs to provide complete visibility into the performance of applications and resources.

AppOptics, Pingdom, and Loggly integrated into one APM platform

Metrics, traces, logs, and user-experience monitoring are available in one platform

Start monitoring for free