Use Cases By Industry
Use Cases by Challenge
Technical Documentation
Educational Resources
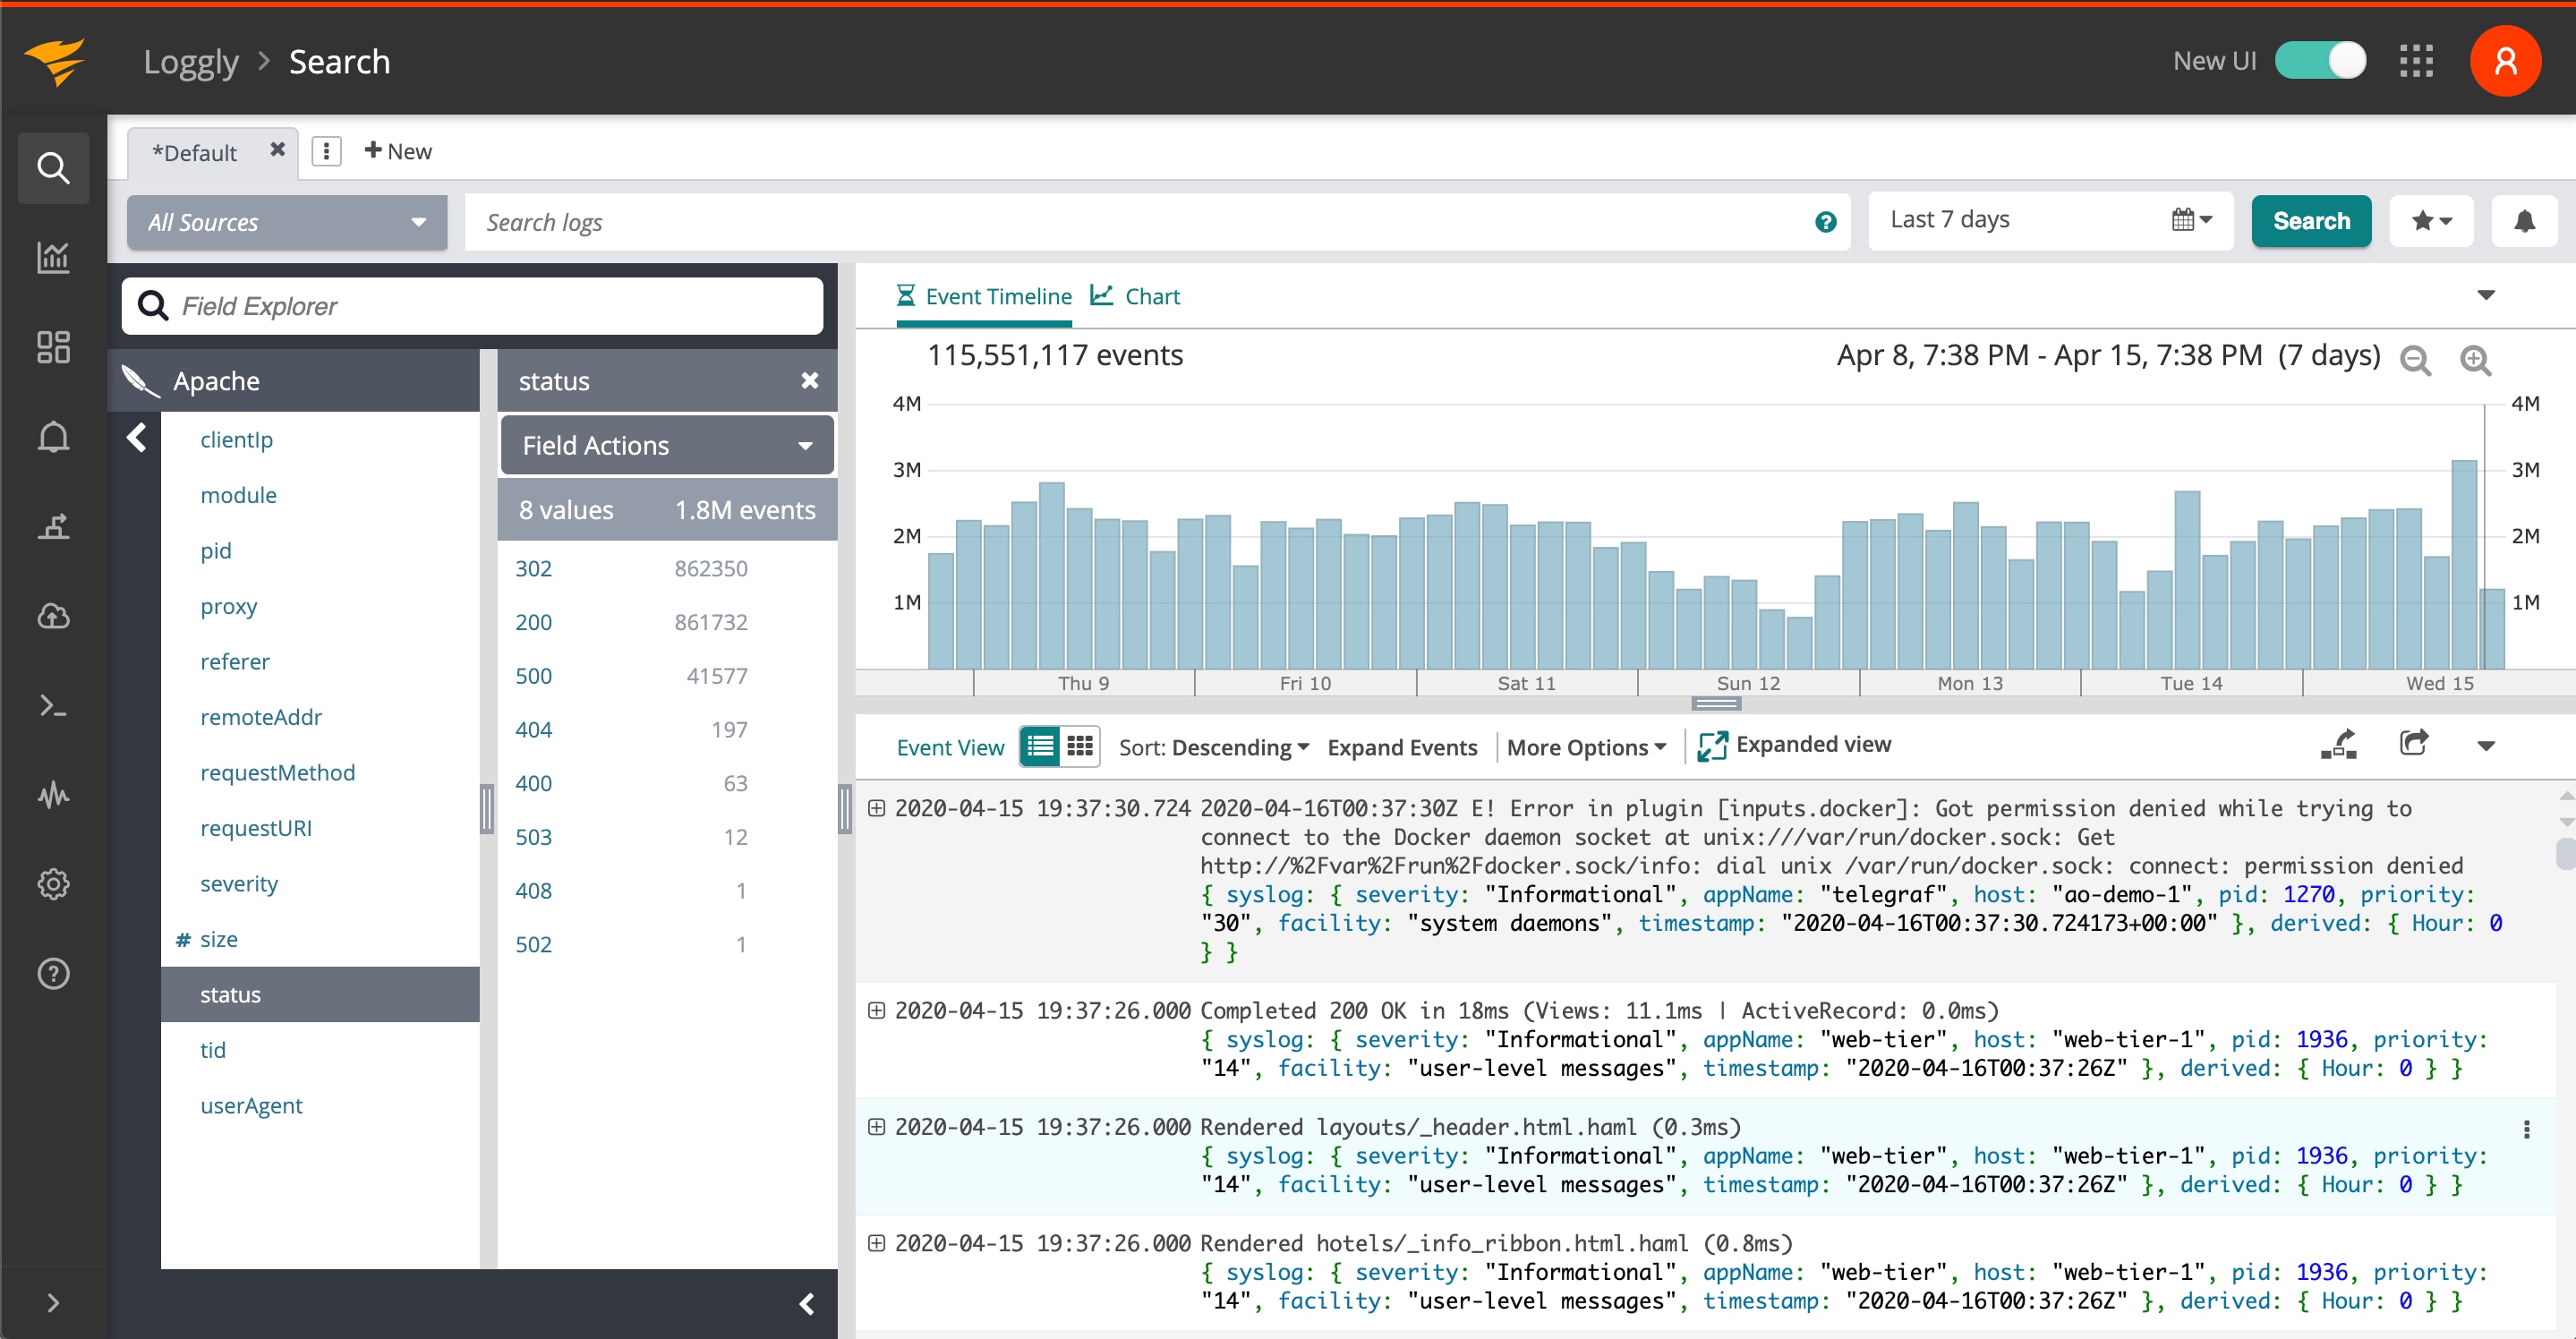
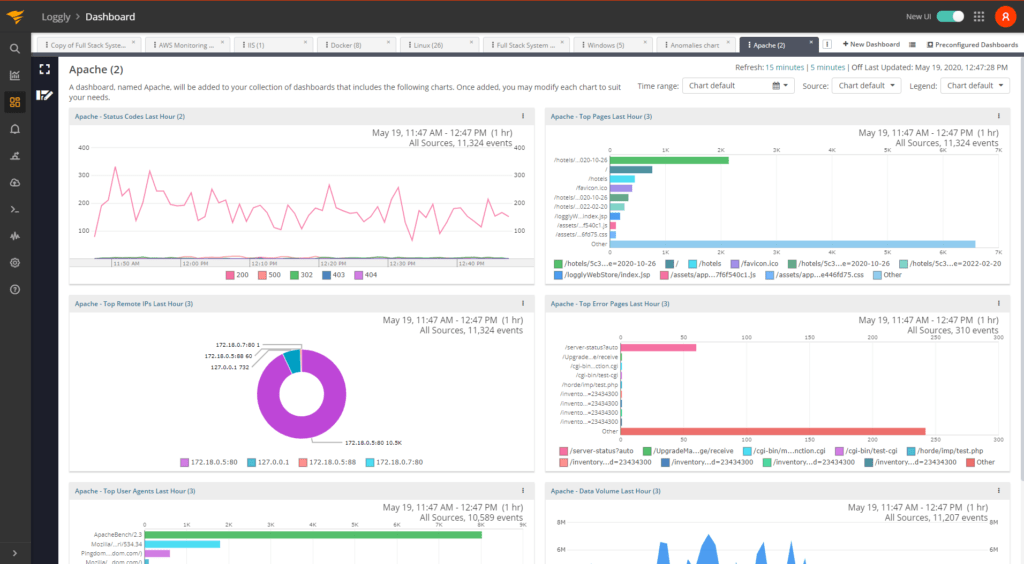
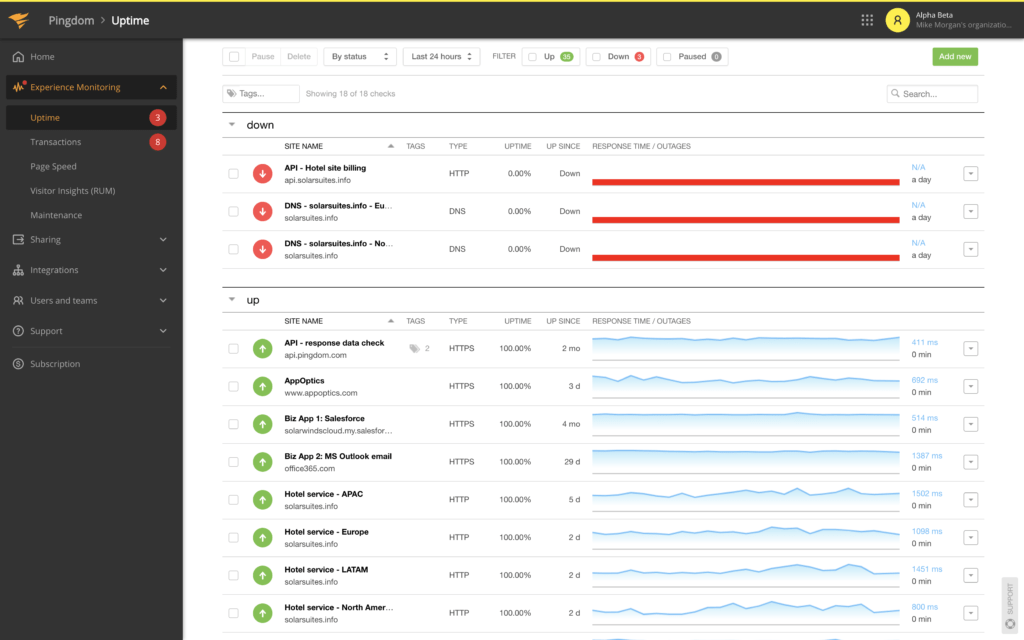
The host machines, operating systems, applications, networking devices, and other hardware and software components in your IT infrastructure consistently produce log data. Collecting and analyzing this log data is critical in assessing overall system health and troubleshooting problems. SolarWinds® Loggly® helps you collect, store, and analyze log data efficiently and provides enhanced monitoring and troubleshooting capabilities when combined with SolarWinds Pingdom and SolarWinds AppOptics.
Loggly aggregates logs from a wide range of sources in your IT environment, including multiple cloud services, operating systems, container clusters, microservices, database management systems, web and mobile applications, and networking devices.
Loggly uses built-in parsing rules to process structured, semi-structured, and unstructured data into a unified format and provides in-depth visualization of log metrics. You can also customize the parsing rules and dashboards. The search query language in Loggly is based on Apache Lucene and supports robust search logic, which allows you to efficiently query massive amounts of log data.
Loggly learns about normal patterns in your log data and reports unusual patterns, continuously enabling you to analyze events before they impact your infrastructure and business. It also lets you set up rules to trigger automated alerts based on certain conditions or events in log data.
Pingdom enhances the log analysis in Loggly by monitoring web applications from an end-user perspective—Pingdom monitors application performance in the open internet using both real user monitoring (RUM) and synthetic monitoring.
Pingdom RUM tracks the actual end-user experience on your web application in real time. Pingdom synthetic monitoring uses its global probe server network to perform uptime checks, report page load times, and monitor critical transaction flows.
You can correlate events or trends as displayed in the Loggly log explorer view with the monitoring reports in Pingdom to identify deteriorating performance or pinpoint an event’s impact on end users in a geographic location, for example.
Deploying Loggly and Pingdom provides enhanced context for web application incidents and events. The following examples highlight how Loggly and Pingdom can help you together:
Loggly and Pingdom offer free trials and don’t require you to set up additional hardware.
Loggly also doesn’t require you to install agents to aggregate log data. You can send logs to Loggly in a secure manner from the sources using a local syslog agent or simple scripts over standard protocols such as HTTP/S, TCP, and UDP.
Pingdom RUM requires you to add a lightweight JavaScript snippet to your web application. With just this one snippet, Pingdom can monitor every page. To get started with uptime and page speed monitoring, you can add URLs and specify notification settings in a few clicks. For transaction monitoring, you can record transaction steps using the Web Transaction Recorder, which generates a script for you.
AppOptics is an application performance monitoring (APM) tool designed to provide enhanced visibility into application performance. It visualizes your application environment using map views, shows each component’s relationship with other parts of the application, and uses distributed tracing to track requests served.
Integrating Loggly with AppOptics helps you view the log data relevant to a specific trace. This provides you more context when troubleshooting problems and identifying root causes.
Loggly helps you collect, store, and analyze log data efficiently and provides enhanced monitoring capabilities when combined with Pingdom and AppOptics.