Synthetic Monitoring

Simulate visitor interaction with your site to monitor the end user experience.

View Product Info

FEATURES

Simulate visitor interaction

Identify bottlenecks and speed up your website.

Learn More

Real User Monitoring

Enhance your site performance with data from actual site visitors

View Product Info

FEATURES

Real user insights in real time

Know how your site or web app is performing with real user insights

Learn More

Infrastructure Monitoring Powered by SolarWinds AppOptics

Instant visibility into servers, virtual hosts, and containerized environments

View Infrastructure Monitoring Info
Comprehensive set of turnkey infrastructure integrations

Including dozens of AWS and Azure services, container orchestrations like Docker and Kubernetes, and more 

Learn More

Application Performance Monitoring Powered by SolarWinds AppOptics

Comprehensive, full-stack visibility, and troubleshooting

View Application Performance Monitoring Info
Complete visibility into application issues

Pinpoint the root cause down to a poor-performing line of code

Learn More

Log Management and Analytics Powered by SolarWinds Loggly

Integrated, cost-effective, hosted, and scalable full-stack, multi-source log management

 View Log Management and Analytics Info
Collect, search, and analyze log data

Quickly jump into the relevant logs to accelerate troubleshooting

Learn More

Java Application Monitoring

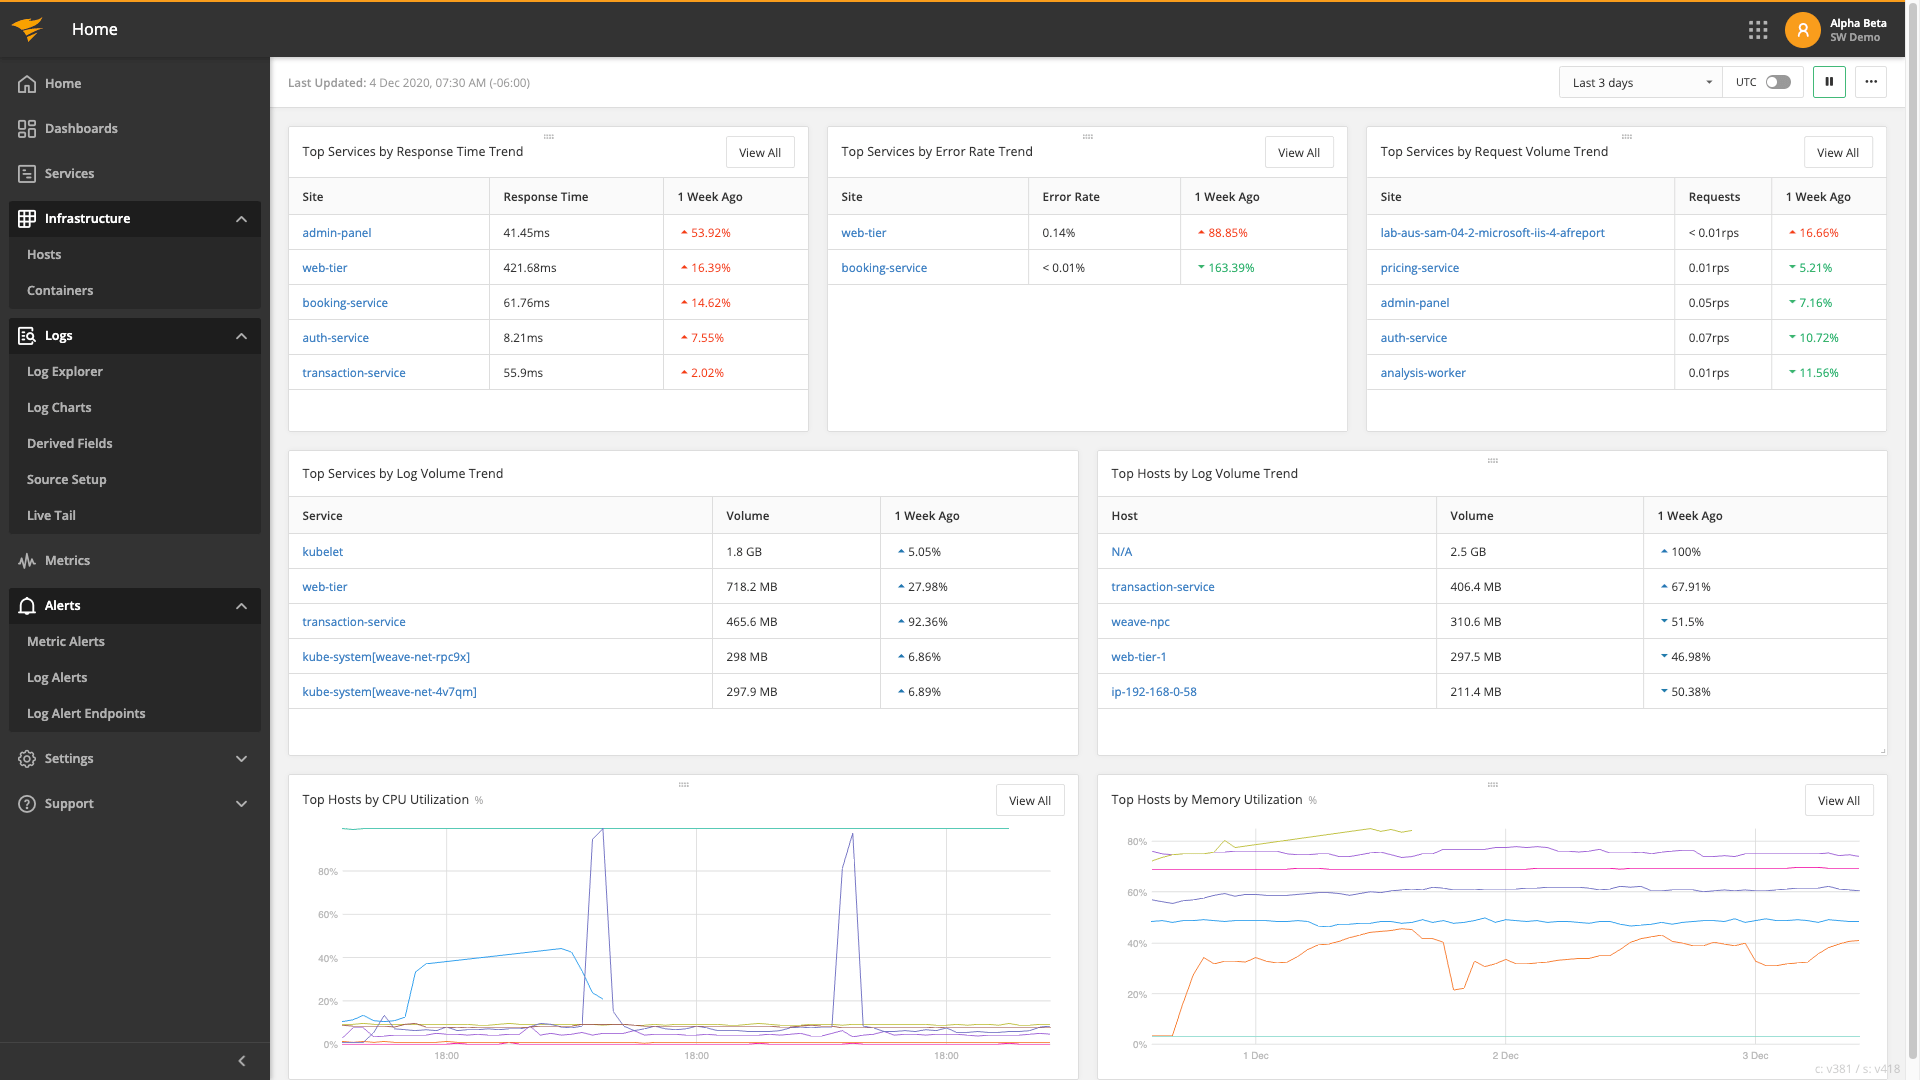
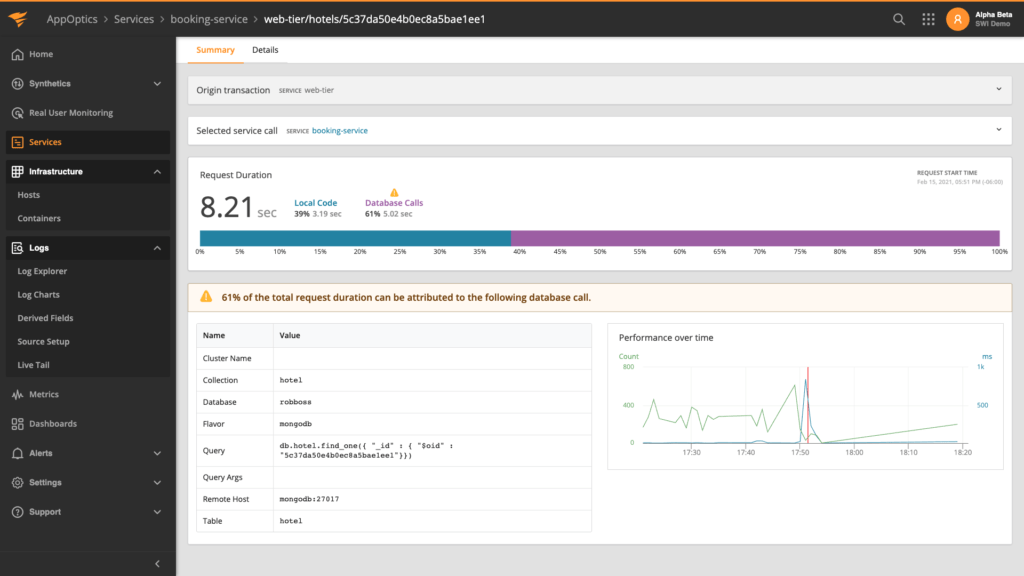
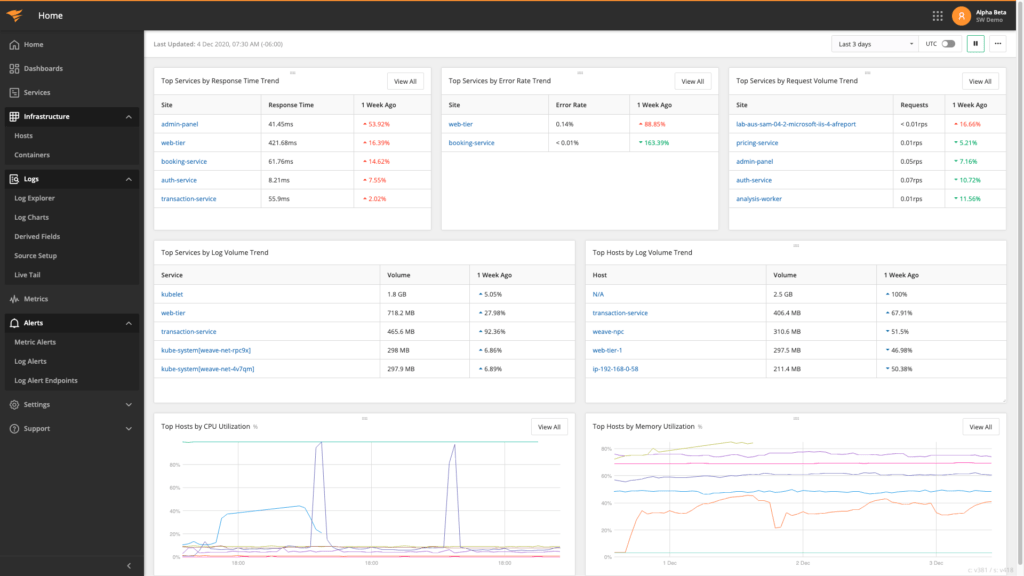
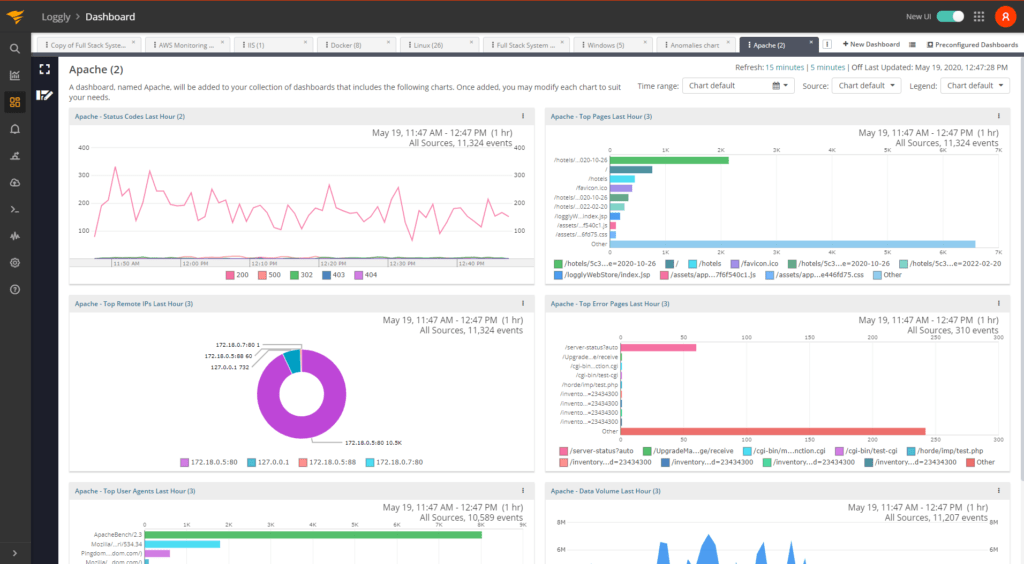
Java applications power some of the most critical business transactions, so monitoring Java applications and their underlying infrastructure is essential to ensure high performance. You can manage Java application performance using SolarWinds® Pingdom® for real-time visibility and monitoring of your web applications. You can also integrate Pingdom with SolarWinds AppOptics and SolarWinds Loggly® to build a more comprehensive application performance management (APM) experience.

Embrace Real User Perspective With Pingdom

If you aren’t already leveraging your end users, you can make data-driven performance decisions by gaining a real-time understanding of their experience with your web application.

Pingdom delivers invaluable metrics and insights synthesized from end-user interactions by collecting performance data from their browsers in real time. Additionally, it checks critical application transaction flows (e.g., logins or cart checkouts) using simulation and monitors application performance and server availability in the World Wide Web using a network of 100+ probe servers spread across the world.

Manage Java Application Performance With AppOptics

AppOptics provides the metrics, insights, and analysis you need to deliver resilient and high-performing Java applications. It helps you hunt down performance bottlenecks with service-level and trace-level root cause summaries.

AppOptics offers auto-instrumentation capabilities to simplify Java application monitoring deployment. It traces application requests using distributed tracing to uncover internal transaction flows and performance latency by offering intuitive application service maps. The APM tool also performs live code profiling to pinpoint issues down to the line of code.

Integrate Insights From AppOptics and Pingdom

Collectively, AppOptics and Pingdom help you make more informed decisions and remediate performance issues early on.

Let’s say Pingdom reports a sudden traffic drop in the EU region. Based on this alert, you examine AppOptics performance data and identify java.lang.OutOfMemoryError errors from the application runtime, indicating a possible memory leak problem. You can quickly correlate these two insights from Pingdom and AppOptics to identify root causes and remediate the issue. This also helps you examine the application environment further to prevent such a problem from arising in another region.

Evaluate AppOptics, Loggly and Pingdom

Together, Pingdom, AppOptics, and Loggly improve your Java application monitoring strategy and help you better manage performance. You can test these APM tools with 30-day free trials to understand how they can help you stay on top of performance issues. Moreover, they’re simple to deploy and don’t require you to maintain additional IT infrastructure.

Sign up for a free, 30-day trial today

Start monitoring for free