Synthetic Monitoring

Simulate visitor interaction with your site to monitor the end user experience.

View Product Info

FEATURES

Simulate visitor interaction

Identify bottlenecks and speed up your website.

Learn More

Real User Monitoring

Enhance your site performance with data from actual site visitors

View Product Info

FEATURES

Real user insights in real time

Know how your site or web app is performing with real user insights

Learn More

Infrastructure Monitoring Powered by SolarWinds AppOptics

Instant visibility into servers, virtual hosts, and containerized environments

View Infrastructure Monitoring Info
Comprehensive set of turnkey infrastructure integrations

Including dozens of AWS and Azure services, container orchestrations like Docker and Kubernetes, and more 

Learn More

Application Performance Monitoring Powered by SolarWinds AppOptics

Comprehensive, full-stack visibility, and troubleshooting

View Application Performance Monitoring Info
Complete visibility into application issues

Pinpoint the root cause down to a poor-performing line of code

Learn More

Log Management and Analytics Powered by SolarWinds Loggly

Integrated, cost-effective, hosted, and scalable full-stack, multi-source log management

 View Log Management and Analytics Info
Collect, search, and analyze log data

Quickly jump into the relevant logs to accelerate troubleshooting

Learn More

Bounce Rate Checker and Web Analytics Tool

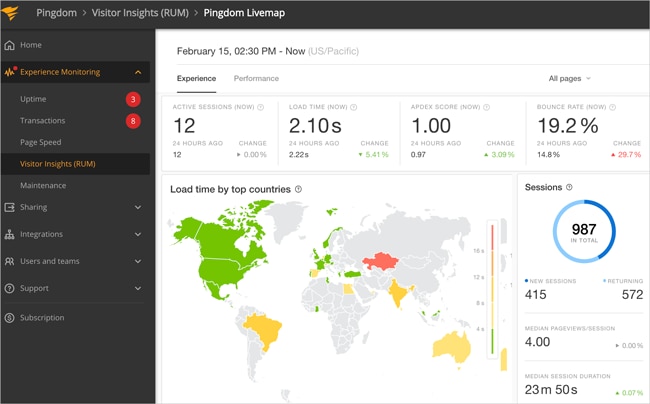
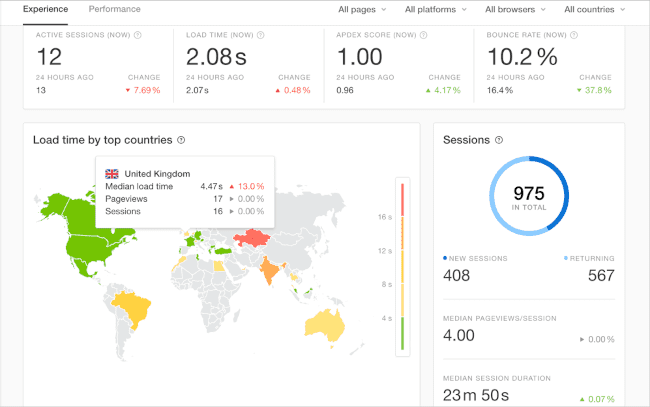
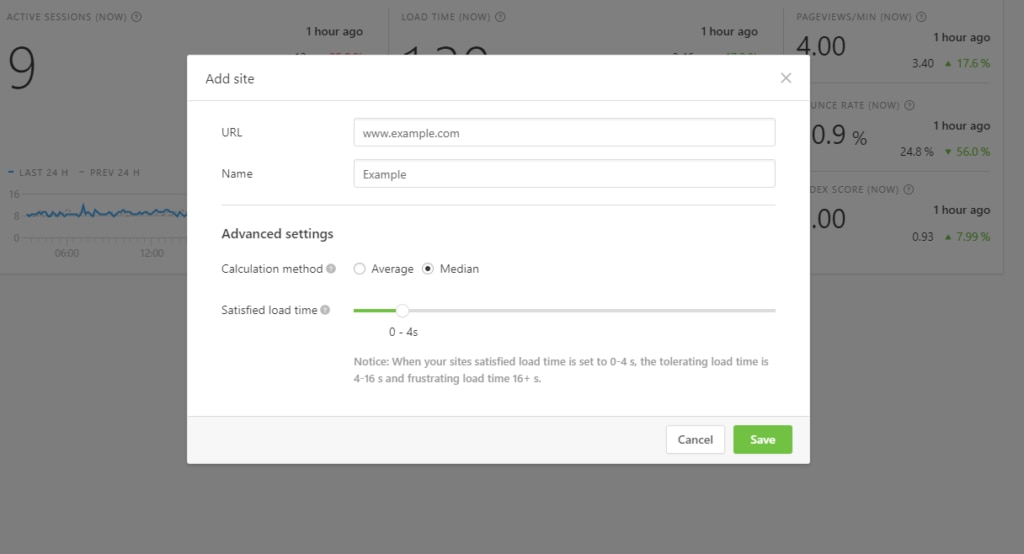
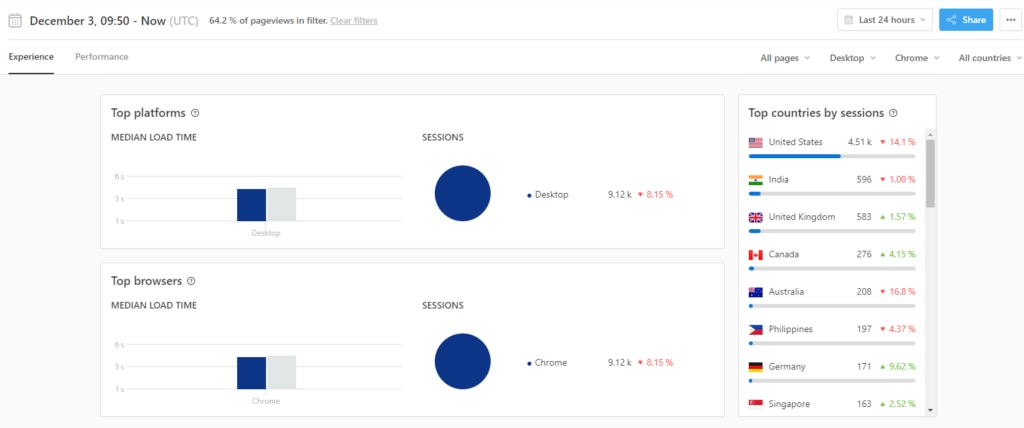
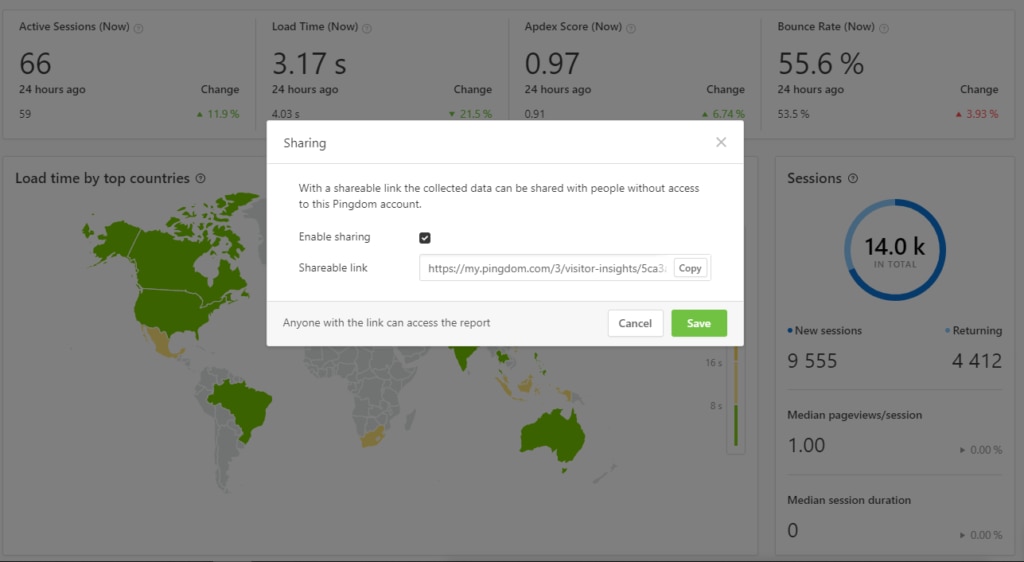
Bounce rate is an important metric that helps you understand your website’s relevance and helps you analyze the end-user experience. Continuously monitoring bounce rate can help you make data-driven optimizations to improve the end-user experience. You can track bounce rate and other critical digital experience metrics with SolarWinds® Pingdom® real user monitoring (RUM). It helps you find performance issues and optimization opportunities in real time.


Web Analytics for Digital Marketers

You can monitor the end-user experience as visitors interact with your website in real time and understand their geographic distribution with Pingdom RUM’s live geographic mapping. Pingdom also helps you understand how page load times affect the user experience and bounce rates. You can compare web performance over time with historical data to measure the impacts of your marketing efforts.

RUM get started

Get Started Typically in Minutes

You can start gathering real user metrics by adding a lightweight code snippet to the websites you want to monitor, and all pages on each site will be monitored. Once you add the code snippet, typically within seconds, Pingdom starts gathering user behavior data and provides real-time insights such as active sessions, average load time, and bounce rates. In addition to this, it helps you understand how performance issues affect various user groups and geographic locations.

RUM filtered view

Get In-depth Insights With Advanced Filtering

With advanced filtering, you can customize how you view and explore real user data and gain insights, such as what’s causing frequent performance issues and what fixes you should prioritize. For example, you can understand if a performance issue is pertinent only to specific browsers, devices, or geographic locations. You can also identify commonalities among your most valued visitors in the way they use your website and applications, which helps you make data-driven optimization decisions and deliver exceptional web performance to everyone.

RUM Apdex Score

Set Performance Levels and Measure Satisfaction

While you can monitor digital experience metrics, such as page load times and response times, Pingdom RUM also helps you set acceptable performance levels to help make sure your visitors’ experience is seamless. In addition, you can measure satisfaction levels with Apdex score, a widely followed satisfaction indicator.

RUM sharing report

Detailed and Customizable Reports

Pingdom RUM dashboards gives you a high-level performance summary of the end-user experience with your web applications, or dive deeper into page-level metrics of important pages such as signup pages and blog pages. You can share these reports with key stakeholders and your customers, and they can customize the view based on time range, browser or device used, and location.

Track bounce rate and digital experience metrics

Continuously monitoring bounce rate can help you make data-driven optimizations to improve the end-user experience.

Start monitoring for free