Synthetic Monitoring

Simulate visitor interaction with your site to monitor the end user experience.

View Product Info

FEATURES

Simulate visitor interaction

Identify bottlenecks and speed up your website.

Learn More

Real User Monitoring

Enhance your site performance with data from actual site visitors

View Product Info

FEATURES

Real user insights in real time

Know how your site or web app is performing with real user insights

Learn More

Infrastructure Monitoring Powered by SolarWinds AppOptics

Instant visibility into servers, virtual hosts, and containerized environments

View Infrastructure Monitoring Info
Comprehensive set of turnkey infrastructure integrations

Including dozens of AWS and Azure services, container orchestrations like Docker and Kubernetes, and more 

Learn More

Application Performance Monitoring Powered by SolarWinds AppOptics

Comprehensive, full-stack visibility, and troubleshooting

View Application Performance Monitoring Info
Complete visibility into application issues

Pinpoint the root cause down to a poor-performing line of code

Learn More

Log Management and Analytics Powered by SolarWinds Loggly

Integrated, cost-effective, hosted, and scalable full-stack, multi-source log management

 View Log Management and Analytics Info
Collect, search, and analyze log data

Quickly jump into the relevant logs to accelerate troubleshooting

Learn More

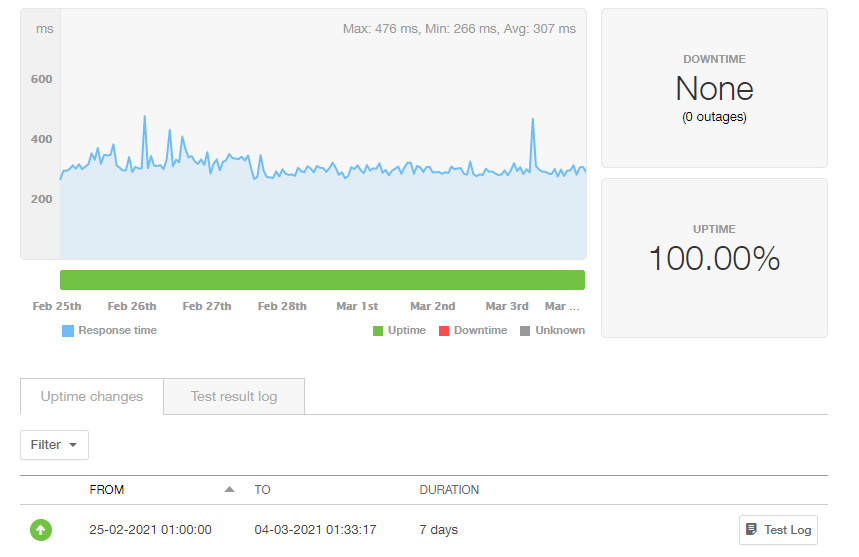
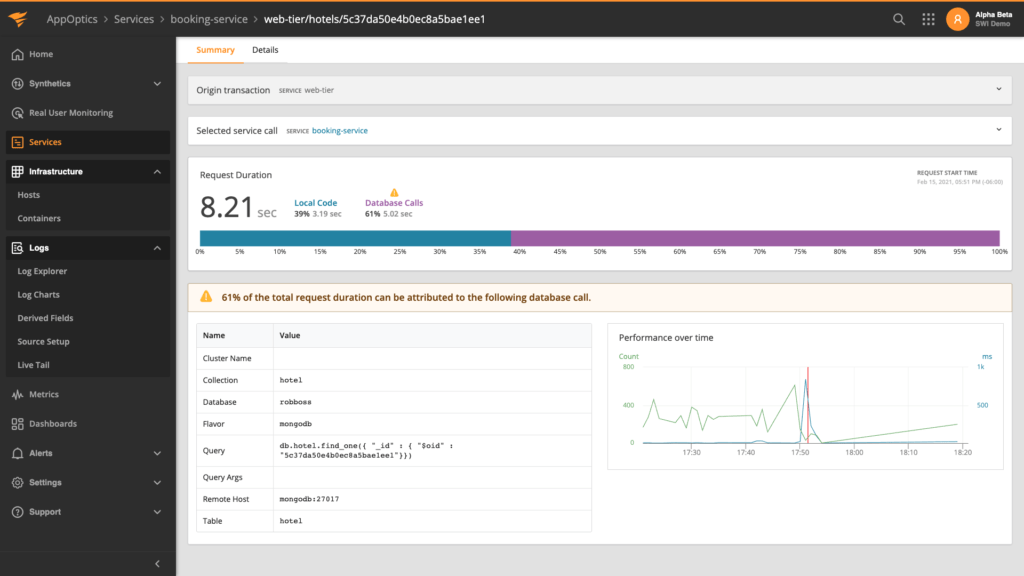
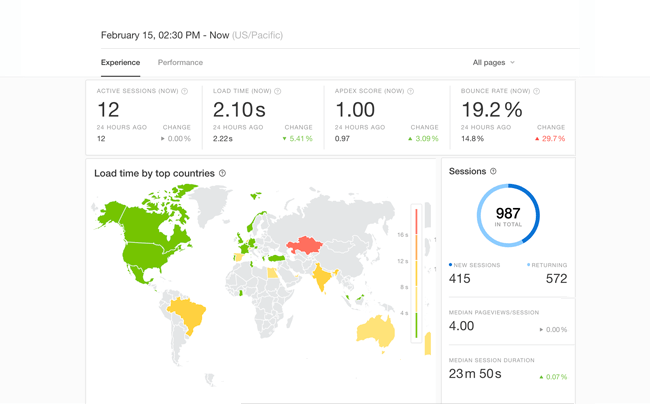
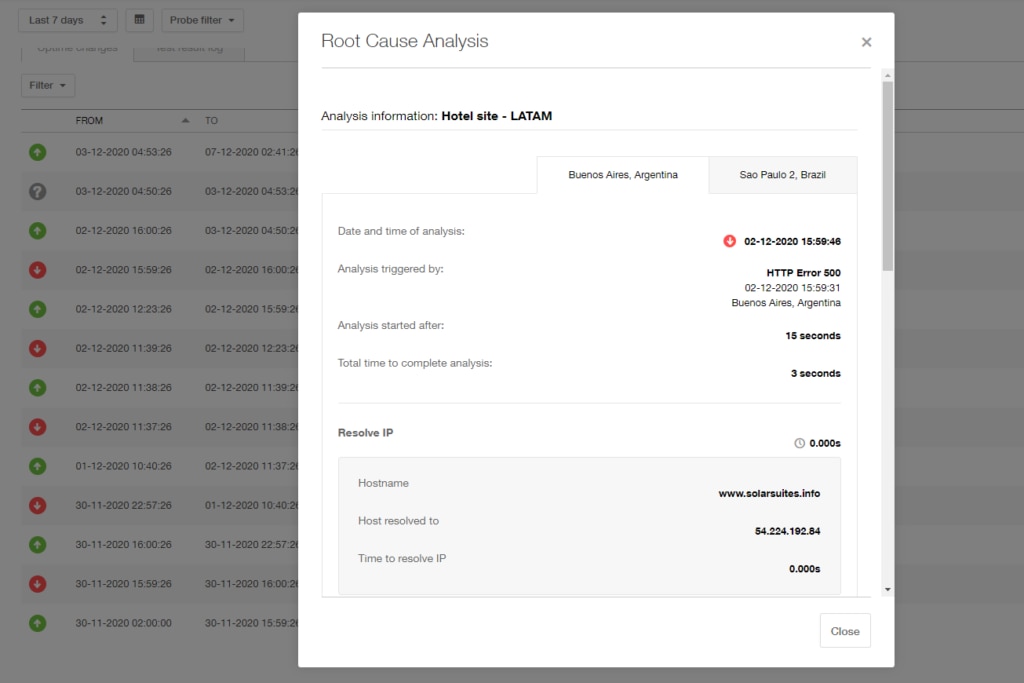
Web Server Availability Monitoring

Stay on top of outages and potential issues with our powerful web server availability monitoring tool. Monitor the performance and availability of your web servers with SolarWinds® Pingdom® and get in-depth insights into CPU and memory utilization with SolarWinds AppOptics.

Track Server Resources and Monitor Website Availability

Test the availability of servers, applications, and websites instantly with Pingdom and get deeper insights into their resource utilization with AppOptics.


Tracking a server’s key resources – such as CPU, memory, disk utilization, and I/O capacity—is crucial to finding out the potential issues leading to application performance and downtime. Pingdom integrates well with AppOptics to enable infrastructure capabilities, get the client-side perspective of availability and performance, and provide code-level visibility to ensure well-performing applications, websites, and servers.

real user monitoring

Monitor the End-User Experience

Check website availability from different geographic locations with the uptime monitoring feature in Pingdom and understand the reasons behind website slowdowns with page speed analysis. Pingdom also allows you to simulate visitor interactions with your site. You can test simple and complex transactions (such as user logins and checkouts) with transaction monitoring.


Understand the site visitor’s experience and get deeper insights into users’ digital behaviors. With the scalable and lightweight real user monitoring (RUM) feature in Pingdom, it’s easy to monitor millions of pageviews and compare the current usage metrics with those over the last month or year to better understand your website’s performance.

Uptime Root cause analysis

Monitor Server Assets Proactively

Identify potential outages, visualize web server performance, and address network issues proactively.


Pingdom performs a root cause analysis once its monitoring network detects downtime. It helps collect crucial data to determine the actual cause of an outage or an error. The root cause analysis in Pingdom also performs traceroute and provides additional information about IP connectivity issues, missing pages, HTTP 404 errors (page not found), HTTP 503 errors (service unavailable), HTTP 401 errors (unauthorized access), and HTTP 403 errors (forbidden).

Integrate Apps

Alerting and Reporting

It’s crucial for businesses to know when their server assets are down or unavailable. Pingdom is an event-based solution designed to notify teams about issues in real time by sending alerts via SMS, email, or push notifications. These alerts can be integrated with applications such as Slack, PagerDuty, webhooks, and Hipchat. Teams can also track and test page speed, availability, and performance of servers, website, and applications.


Pingdom provides several types of reports. Uptime reports provide data based on the uptime, downtime, and response time of web servers and applications. Transaction reports are similar to uptime reports, but they specifically provide data on transaction checks. Page speed reports include information regarding page load time, performance grade (rated by Yslow), the number of requests, and page size. Real user monitoring (RUM) reports give insight into the load time of the website from different platforms, browsers, and geographic locations.

Pingdom API Token

Get Powerful Plug-Ins and Lightweight API

Pingdom offers plug-ins to collect RUM data instantly and a developer-friendly API to get real-time web performance insights into your existing systems.

  • Pingdom Plug-Ins – View and analyze the performance data of your website and others using the Pingdom real user monitoring bookmarklet. It enables users to view real user data based on visits over different periods of time. Pingdom also offers WordPress and Slack plug-ins to collect website visitors’ data and send you instant notifications in Slack when your website is unavailable.
  • Pingdom API – SolarWinds Pingdom uses a RESTful and HTTP-based API. HTTP requests make communication easier between the existing applications and systems, and the API enables users to write their own applications and scripts using the functionality in Pingdom. These scripts provide application performance insights into your existing systems or portals. The API also helps automate workflows based on the availability and performance tests Pingdom performs.

Track Server Resources and Monitor Website Availability

Test the availability of servers, applications, and websites instantly with Pingdom and get deeper insights into their resource utilization with AppOptics.

Start monitoring for free