Synthetic Monitoring

Simulate visitor interaction with your site to monitor the end user experience.

View Product Info

FEATURES

Simulate visitor interaction

Identify bottlenecks and speed up your website.

Learn More

Real User Monitoring

Enhance your site performance with data from actual site visitors

View Product Info

FEATURES

Real user insights in real time

Know how your site or web app is performing with real user insights

Learn More

Infrastructure Monitoring Powered by SolarWinds AppOptics

Instant visibility into servers, virtual hosts, and containerized environments

View Infrastructure Monitoring Info
Comprehensive set of turnkey infrastructure integrations

Including dozens of AWS and Azure services, container orchestrations like Docker and Kubernetes, and more 

Learn More

Application Performance Monitoring Powered by SolarWinds AppOptics

Comprehensive, full-stack visibility, and troubleshooting

View Application Performance Monitoring Info
Complete visibility into application issues

Pinpoint the root cause down to a poor-performing line of code

Learn More

Log Management and Analytics Powered by SolarWinds Loggly

Integrated, cost-effective, hosted, and scalable full-stack, multi-source log management

 View Log Management and Analytics Info
Collect, search, and analyze log data

Quickly jump into the relevant logs to accelerate troubleshooting

Learn More

Kubernetes Monitoring

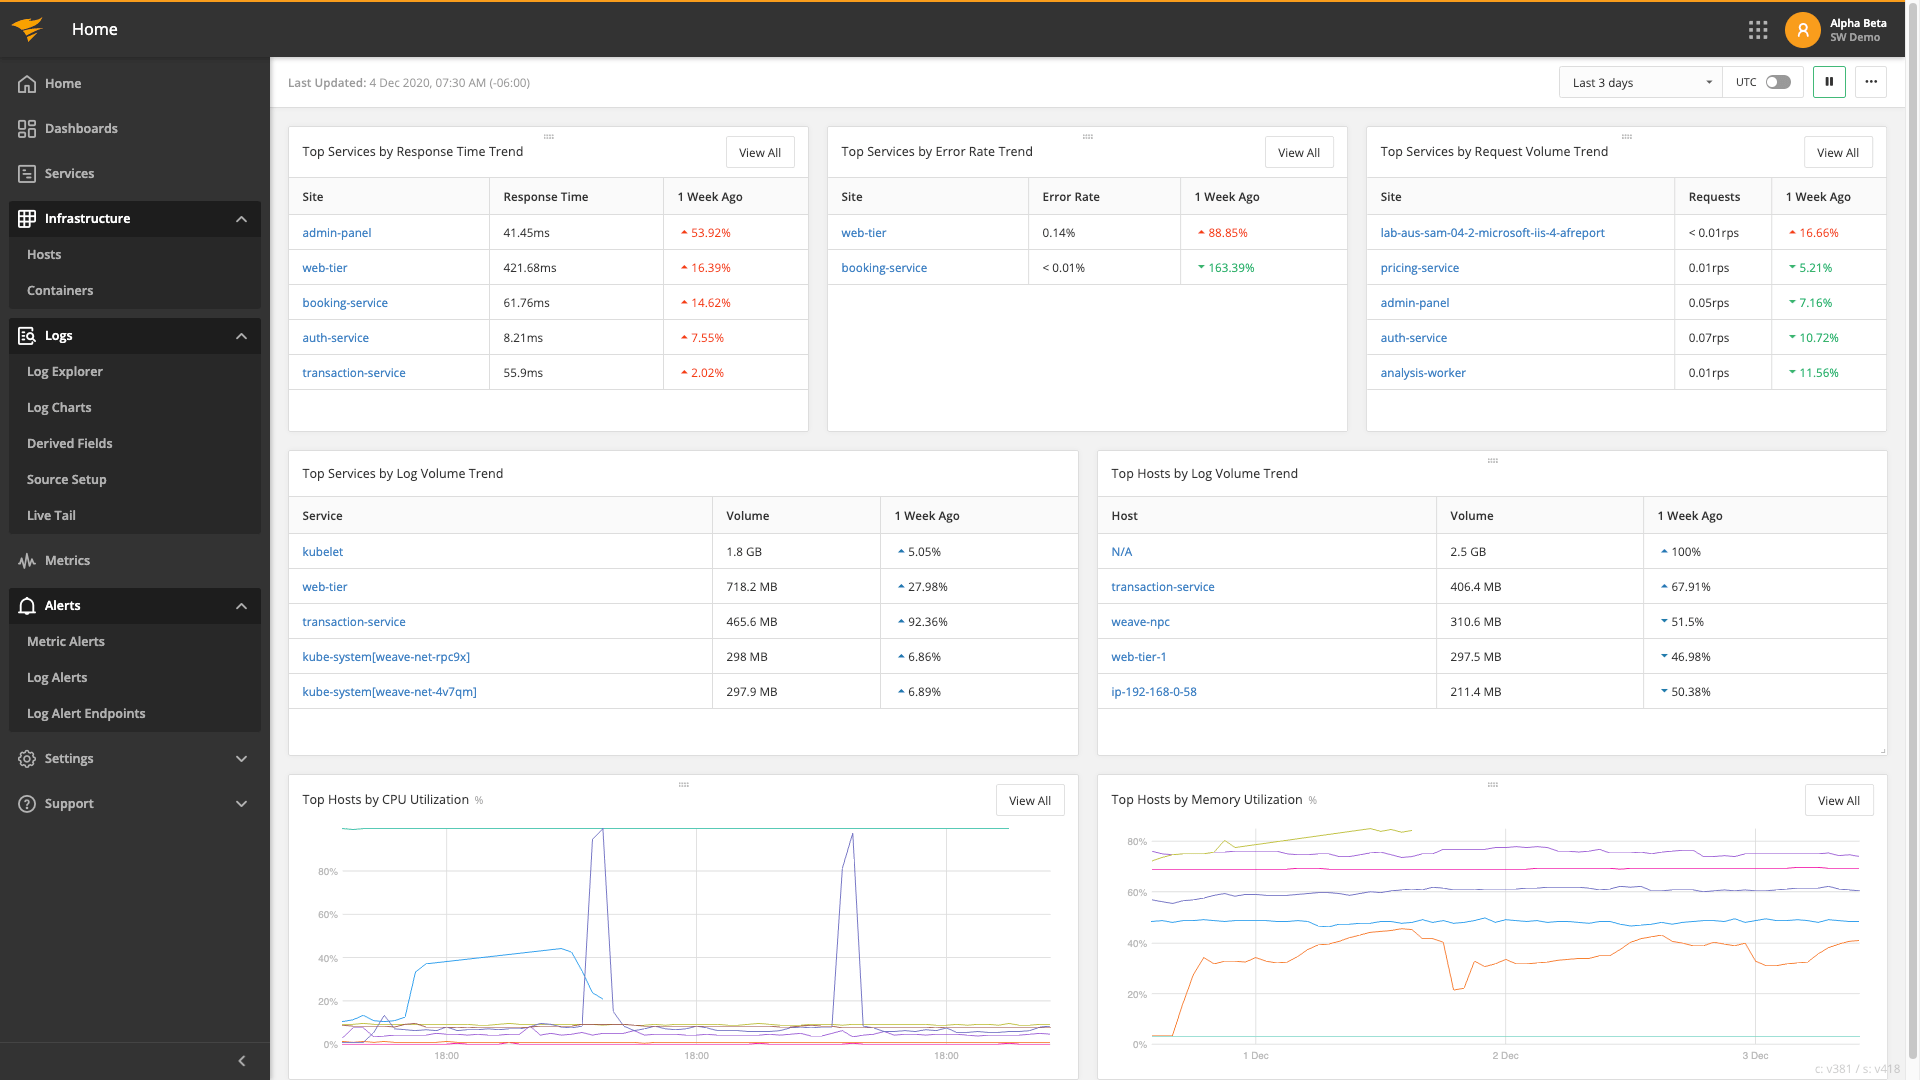
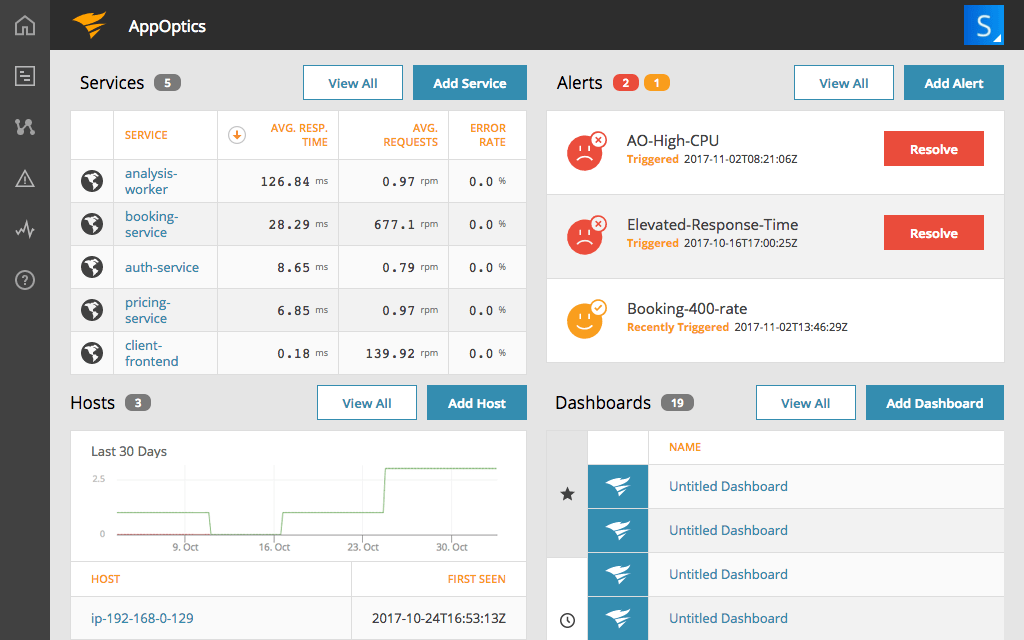
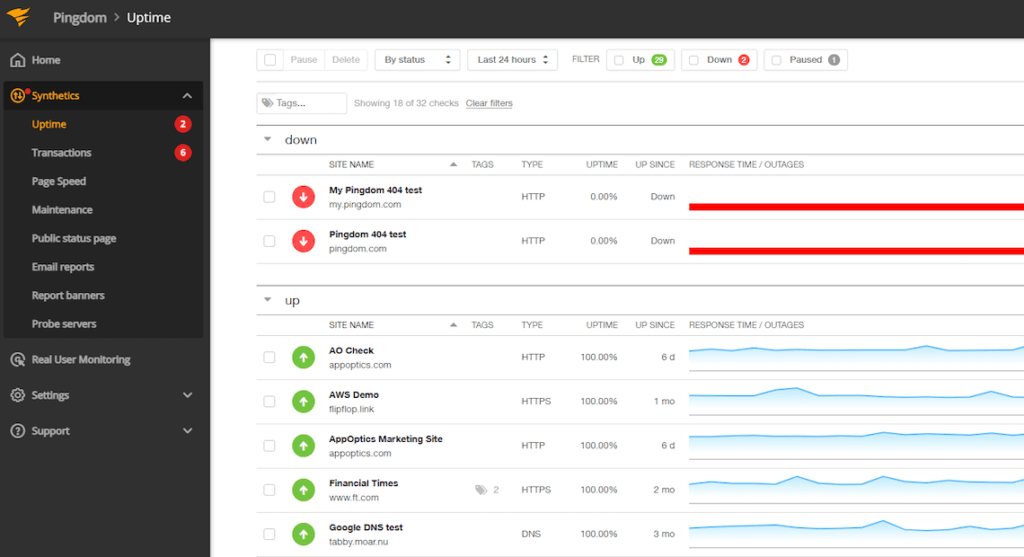
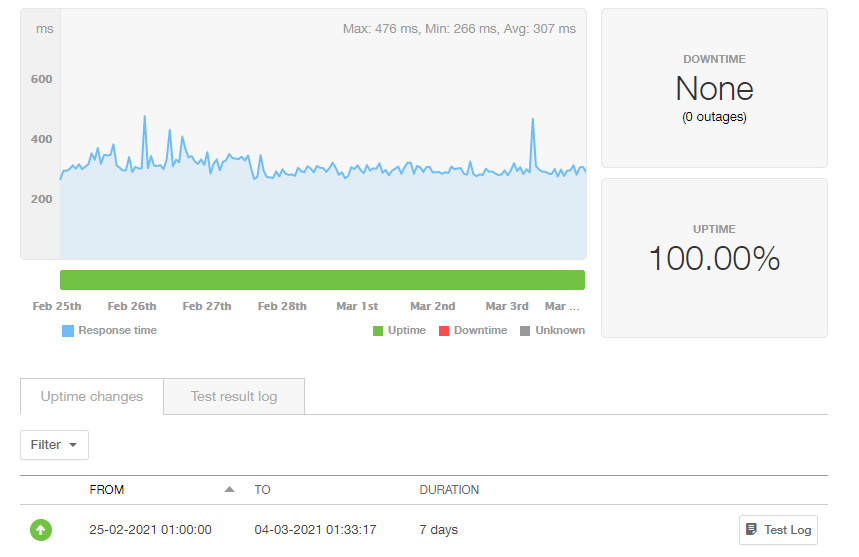
Kubernetes is one of the most common platforms used to manage distributed, containerized workloads. But you may encounter complex challenges in managing and monitoring Kubernetes-based application deployments and the underlying infrastructure. SolarWinds® AppOptics helps you overcome Kubernetes monitoring challenges by simplifying and integrating infrastructure, application, container, and cluster monitoring in a single pane of glass. For maximum observability of your application stack, you can also enhance AppOptics with SolarWinds Pingdom® (digital experience monitoring) and SolarWinds Loggly® (log management and analytics) to deliver an integrated APM experience.

Streamline Kubernetes Monitoring With AppOptics

AppOptics is a SaaS-based APM and infrastructure monitoring solution capable of monitoring the entire infrastructure, including Kubernetes clusters and applications running on it.

AppOptics distributed tracing coupled with auto-instrumentation capabilities simplifies deployment and gathers dozens of crucial metrics at the full-stack level. It also performs live-code profiling to identify code-level issues. All of this expedites the process of identifying performance bottlenecks and inefficient resource utilization. Furthermore, its trace data and root cause summaries help you minimize the mean time to resolution (MTTR).

No matter where you deploy Kubernetes clusters, AppOptics offers a wide range of out-of-the-box integrations and plugins for monitoring deployment. Moreover, the prebuilt and customizable dashboards visualize dozens of time-series metrics to provide visibility into real-time performance and help analyze historical performance.

Monitor Availability With Pingdom

Pingdom is a robust user-experience monitoring solution. It employs synthetic and real-user monitoring (RUM) techniques to help you understand application availability and performance from the perspective of your users from over 100 locations around the world.

It monitors critical business transaction flows on your application to help you detect transaction failures that impact user experience. This means you’ll always be the first to know if a login, registration, or checkout flow stops working. In order to reduce false-positive alerts, Pingdom double-checks issues before sending a notification that could cause alarm.

The RUM tool in Pingdom directly collects metrics from users’ browsers to offer visibility into end-user experience in real time. This helps identify performance issues synthetic monitoring scenarios don’t cover, offering all-around visibility into application performance in the world wide web.

response time

Better Kubernetes Monitoring With AppOptics and Pingdom

Kubernetes clusters can include tens and hundreds of components like containers, hosts, and middleware that generate time-series data. Sometimes, it can become difficult to shift through metrics and identify subtle performance issues. By augmenting AppOptics monitoring with Pingdom, you can gain visibility into the performance from an end-user perspective.

For example, Pingdom identifies a significant increase in load times in Europe and sends an alert. From the alert summary, you can cross-reference the clusters responsible for application performance in Europe and investigate network usage, web server response, query latency, etc., using trace data from that specific time period. This helps get down to the root cause and remediate the issue to mitigate the impact on end-user experience.

Add Log Analysis to Your Kubernetes Monitoring Strategy

Loggly is a SaaS-based log management tool that integrates with AppOptics to offer more context into trace data by attaching log events. It also reduces context switching by enabling quick access to the log data of relevant containers or hosts from the infrastructure and application service maps provided by AppOptics. Together, AppOptics, Pingdom, and Loggly provide deep visibility into performance and help you identify and fix issues rapidly.


Exploring further? You should check out the SolarWinds Observability SaaS

Sign up for a free, 30-day trial today

If you haven’t experienced the simple-to-install and easy-to-use SolarWinds APM Integrated Experience, maybe now is the time. Explore its comprehensive end-user monitoring, infrastructure and application monitoring, and log management and analytics.

video thumbnail
Start monitoring for free