Synthetic Monitoring

Simulate visitor interaction with your site to monitor the end user experience.

View Product Info

FEATURES

Simulate visitor interaction

Identify bottlenecks and speed up your website.

Learn More

Real User Monitoring

Enhance your site performance with data from actual site visitors

View Product Info

FEATURES

Real user insights in real time

Know how your site or web app is performing with real user insights

Learn More

Infrastructure Monitoring Powered by SolarWinds AppOptics

Instant visibility into servers, virtual hosts, and containerized environments

View Infrastructure Monitoring Info
Comprehensive set of turnkey infrastructure integrations

Including dozens of AWS and Azure services, container orchestrations like Docker and Kubernetes, and more 

Learn More

Application Performance Monitoring Powered by SolarWinds AppOptics

Comprehensive, full-stack visibility, and troubleshooting

View Application Performance Monitoring Info
Complete visibility into application issues

Pinpoint the root cause down to a poor-performing line of code

Learn More

Log Management and Analytics Powered by SolarWinds Loggly

Integrated, cost-effective, hosted, and scalable full-stack, multi-source log management

 View Log Management and Analytics Info
Collect, search, and analyze log data

Quickly jump into the relevant logs to accelerate troubleshooting

Learn More

Docker Monitoring

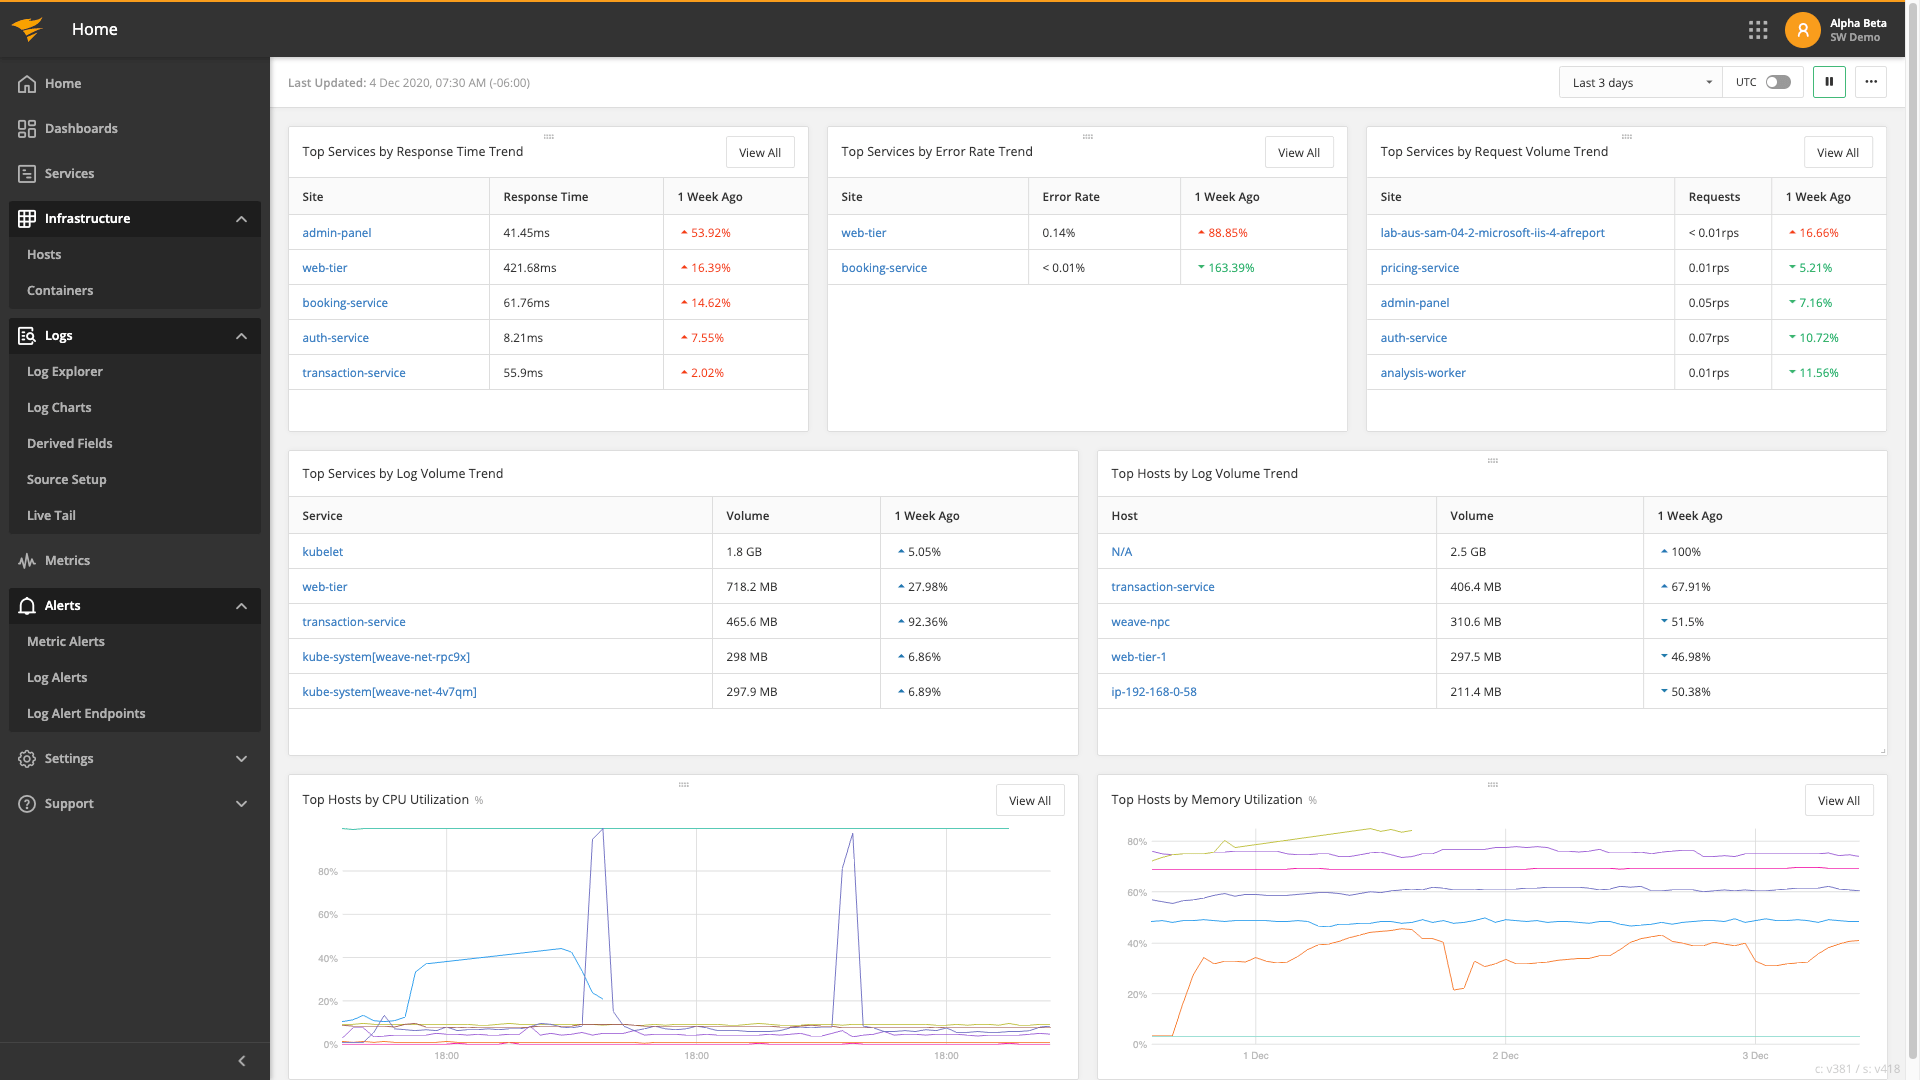
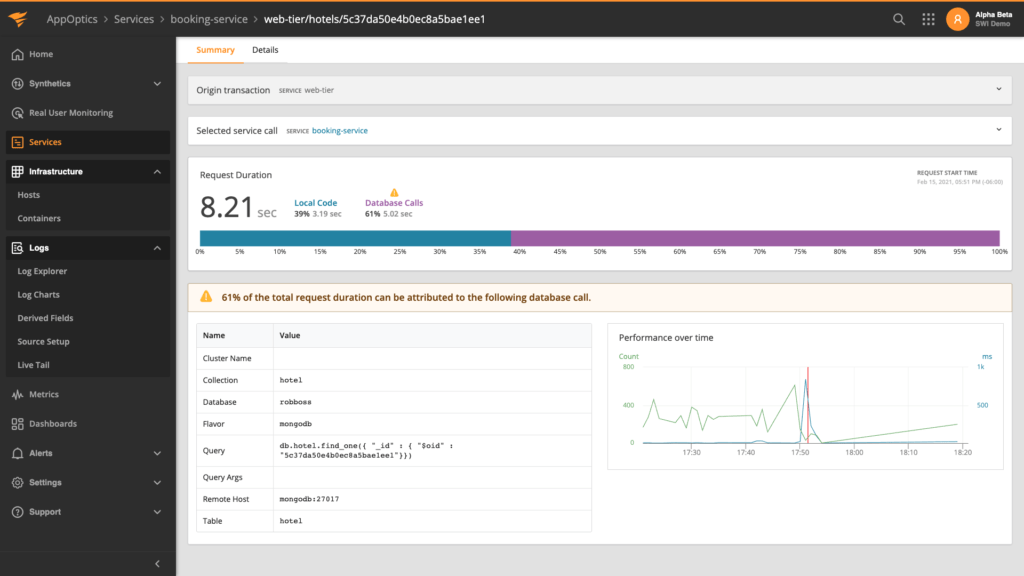
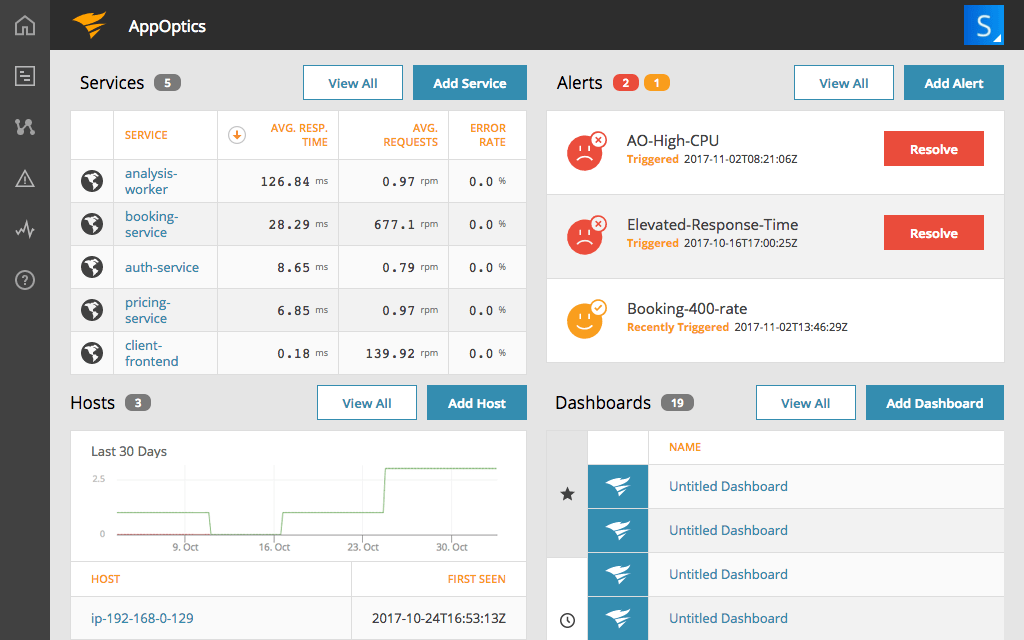
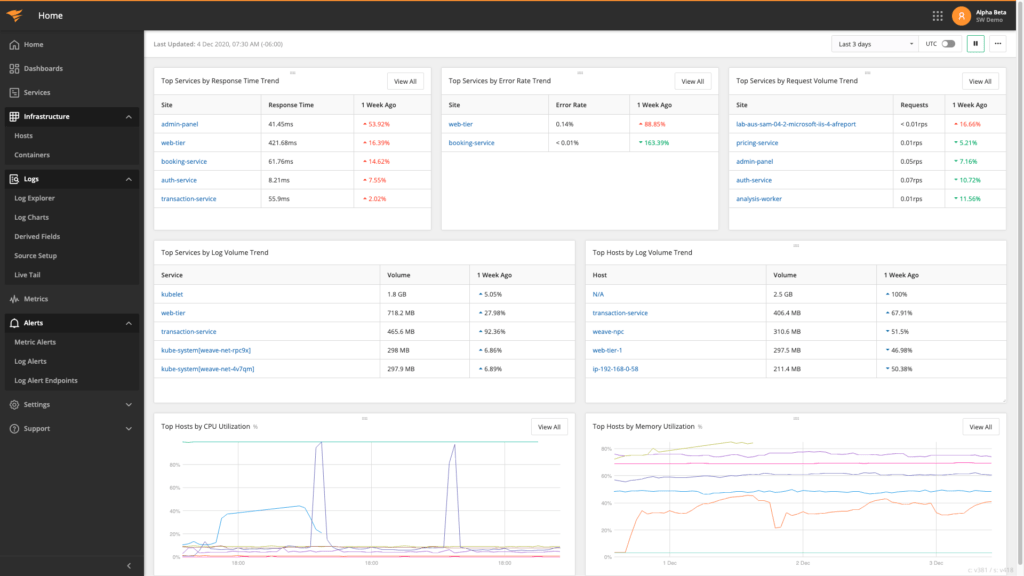
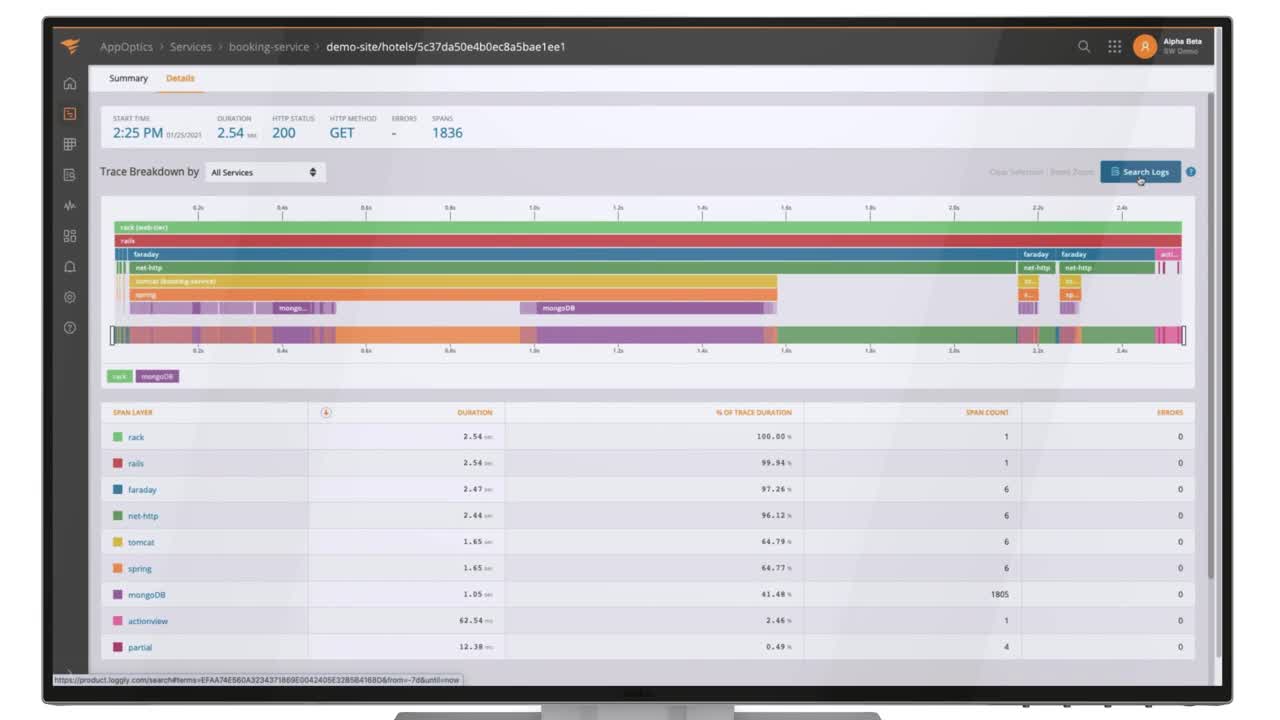
Container-based, distributed applications help implement complex business logic, release updates faster, and scale dynamically. But container-based application environments with hundreds of microservices become chaotic to monitor and manage. Leverage AppOptics’ distributed tracing, code profiling, and full-stack monitoring capabilities to manage application and infrastructure performance. Furthermore, enhance your AppOptics-based performance management by correlating insights from Pingdom and Loggly to benefit from an integrated APM experience.

AppOptics Simplifies Docker Monitoring

AppOptics offers out-of-the-box support for docker monitoring integration and helps minimize monitoring deployment time with no-code configuration. It directly collects time-series data from docker demon and monitors ephemeral Docker containers more effectively with the AppOptics host agent.

Additionally, AppOptics provides full-stack capabilities to monitor application environments, containers, and hosts to gain a comprehensive view of the production environment. Moreover, it offers intuitive infrastructure and application service maps to provide visibility into how various containers, clustered nodes, and services in an application environment depend on each other.

Pingdom Delivers Real User Insights

Internally monitoring the application environment and underlying infrastructure is critical, but sometimes it might not be enough. By gaining visibility into real-user activity in the world wide web, you can uncover more performance insights and stay on top of bottlenecks.

Pingdom delivers performance metrics by collecting data directly from the real-user interactions with your web application. It also simulates common end-user interactions on your application from multiple probe servers across geo-locations to monitor critical transaction flows.

Correlate Insights to Demystify Performance Issues

While AppOptics helps prevent performance bottlenecks and drill down into issues, Pingdom alerts as soon as it detects performance issues from an end-user perspective.

For example, Pingdom double-checks and alerts that a critical transaction flow has failed. The alert data informs that the check failed in the last ten minutes in the U.S. region. Using this insight, you can quickly sift through the AppOptics dashboards to check performance data and alerts in the same period. By correlating the insights from Pingdom and AppOptics, you can apply quick fixes to reduce end-user impact and take preventative measures to stop the issue from recurring.

Quickly Evaluate AppOptics and Pingdom

No matter where you deploy Docker containers and distributed applications, you can simplify monitoring deployment with AppOptics’ 150+ out-of-the-box integrations and plugins. On the other hand, deploying Pingdom is more straightforward with agentless transaction monitoring and end-user monitoring setup. Evaluate AppOptics and Pingdom with free trials to assess their value-addition in your docker monitoring and application performance management strategy.

Why Not Integrate Log Data Insights?

Loggly is a scalable, SaaS-based log analysis tool that can collect log events from dozens of sources without needing proprietary agents. It offers powerful search and query automation capabilities to generate alerts when relevant log events occur.

Loggly integrates with AppOptics and streamlines access to log data by allowing access from infrastructure and application service maps. This reduces context-switching and saves time when troubleshooting time-sensitive issues. It also attaches log data to relevant traces to add more context and insights to root cause analysis.

Collectively, AppOptics, Pingdom, and Loggly help achieve integrated APM experience and eliminate performance blind spots.

Sign up for a free, 30-day trial today

Start monitoring for free