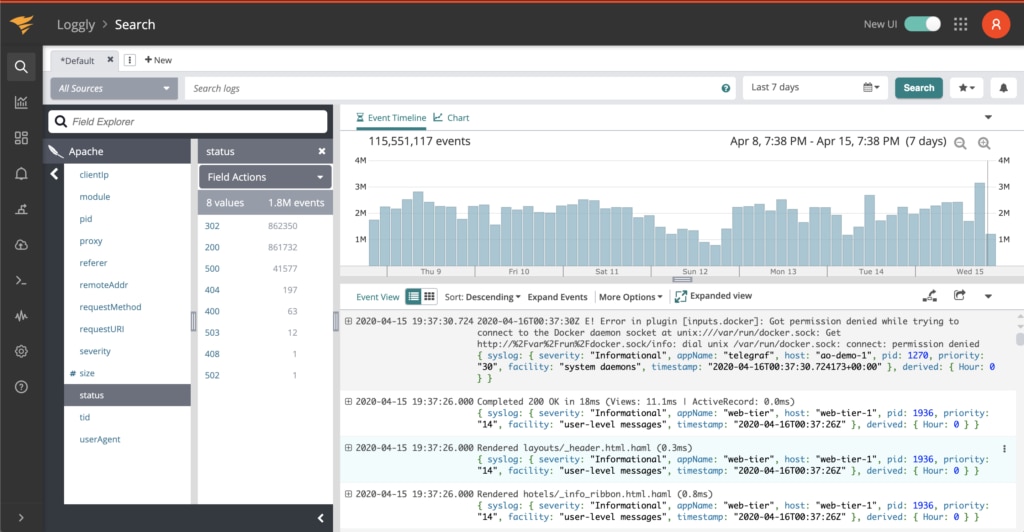
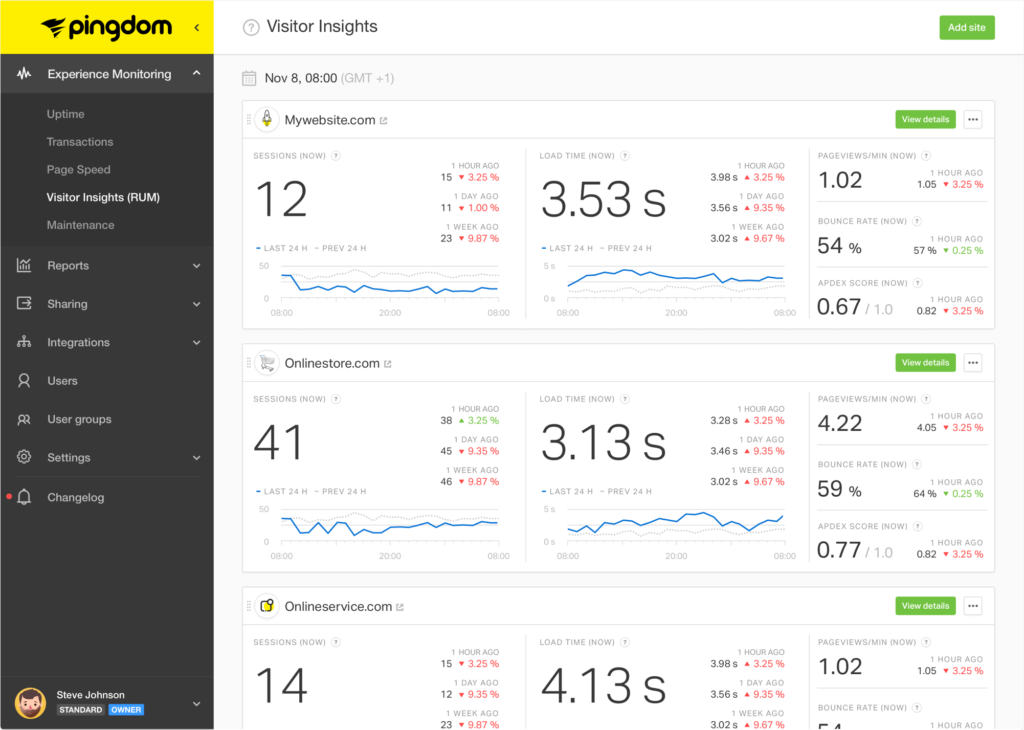
Identify bottlenecks and speed up your website.
Learn More
Know how your site or web app is performing with real user insights
Learn More
Including dozens of AWS and Azure services, container orchestrations like Docker and Kubernetes, and more
Learn More
Pinpoint the root cause down to a poor-performing line of code
Learn More
Quickly jump into the relevant logs to accelerate troubleshooting
Learn More
Use Cases By Industry
Use Cases by Challenge
Technical Documentation
Educational Resources
Ensuring a seamless application experience for customers is critical. Constant monitoring of application performance from server-side to client-side can help identify bottlenecks early on and resolve issues before they can impact the business. Together, SolarWinds® AppOptics™, SolarWinds Pingdom®, and SolarWinds Loggly® provide visibility into application performance and deliver root cause analysis for quick problem remediation.
AppOptics monitors an application and its underlying infrastructure from an IT Ops viewpoint.
Infrastructure Monitoring: AppOptics monitors cloud, on-premises, and hybrid infrastructure and services from providers such as AWS and Azure. It monitors host and virtual machines and reports CPU, memory, storage, and network utilization and provides time-series metrics to help analyze infrastructure utilization.
Application Monitoring: AppOptics provides full visibility into the application stack. It traces requests served using distributed tracing to help understand application performance and identify bottlenecks. It also performs live code profiling to determine what part of the application or line of code is underperforming, whether it’s a JavaScript element, framework, or a library. AppOptics also tracks metrics with unusual performance and pinpoints their impact in the application stack.
Pingdom (client-side monitoring) and AppOptics (server-side monitoring) enhance each other’s capabilities and provide deep visibility into application performance.
AppOptics monitors from a server or inside-out perspective, meaning it monitors the underlying infrastructure and the application environment from inside the organization. On the other hand, Pingdom monitors applications from the perspective of the end user, meaning it reports an application’s performance in the open internet. Pingdom simulates interactions and performs automated checks on the web application and reports metrics generated from the application’s actual end user activity in real time.
API downtime can result in a pool of unserved requests impacting the business’s overall service. With outages occurring any moment, it is crucial to ensure you are the first one to know. Pingdom sends immediate notifications when an API is down and provides relevant information to the teams to help them resolve the issues quickly and confidently.
Loggly is a log analysis and management tool designed to give visibility into infrastructure and application logs, including logs from multiple AWS services, database management systems, and mobile applications. It provides near-instant search results even when the log data is massive. When used together with AppOptics and Pingdom, Loggly enhances end-to-end visibility into application performance. Loggly directly integrates with AppOptics and provides trace-related log details to provide a comprehensive understanding of an issue with root cause analysis.
AppOptics, Pingdom, and Loggly are now integrated into one APM platform. Metrics, traces, logs, and user-experience monitoring are available in one platform. They offer free trials to evaluate their monitoring capabilities and offer SaaS deployment models, requiring no additional hardware management.
AppOptics setup depends on the application stack and environment, and it mostly relies on agent-based monitoring.
Getting started with uptime and page speed monitoring in Pingdom only takes a few steps through its intuitive dashboard. For transaction monitoring, critical site flows can be recorded and translated into a script for you with the web transaction recorder or can be written using the built-in script editor. Pingdom real user monitoring (RUM) relies on a lightweight JavaScript snippet added to the application that collects metrics directly from the users’ browser.
Loggly deployment is more straightforward and doesn’t require installing proprietary agents for log aggregation. It can integrate well with your CI/CD processes and existing software infrastructure.
Metrics, traces, logs, and user-experience monitoring are available in one platform