


Slack experienced an outage in Feb 2025 that impacted many users of the popular Salesforce owned collaboration platform. Given how many teams depend on Slack for their day-to-day operations, news of the outage quickly spread, resulting in critical workflow interruptions for many organizations.
In this article, we’ll unpack the details of the incident using Slack’s status reporting for the outage and other sources. Then, we’ll review three key takeaways for IT operations teams of all sizes. We’ll use information from Slack’s status reporting for the outage.
Scope of the Outage
The Slack outage began on Wednesday, Feb 26, 2025, at around 13:45 UTC. The following Slack features were affected by the outage:
- Login and single sign-on
- Connectivity
- Messaging
- Apps, integrations, and APIs
- Workflows
Slack implemented mitigations to reduce the database load, causing the outage. Although they saw some improvements around 17:32 UTC, the mitigations did not immediately resolve the incident. The outage was resolved around 00:13 UTC on Feb 27, 2025.
The platform has an estimated daily active user (DAU) count of over 40 million, and Slack indicated that a “large percentage” of users were affected. While the exact numbers are unclear, it’s safe to say the outage impacted millions. The outage struck just as the North American workday was ramping up on a Wednesday, and it wasn’t resolved until the business day had ended in many locations.
Additionally, there was a correlated issue with the Slack Events API, and some users had problems with @mentions. This issue extended beyond the resolution of the primary outage. Slack resolved the Events API issue around 07:27 UTC and the @mentions around 16:30 UTC on Feb 27, 2025.
What was the Root Cause of the Outage?
Ultimately, Slack determined the outage’s root cause to be database maintenance activity and a pre-existing defect in a caching system.
According to Slack, the outage was caused by a confluence of two key factors that increased database load and took down about half of the instances that relied on the database. First, there was a defect in Slack’s caching system. The defect alone did not cause an outage. However, the second factor was maintenance activity in the database, which triggered the problem associated with the defect. Together, these issues led to significantly increased database loads.
We don’t have detailed information on the defect and maintenance activity. However, we can hypothesize about the technical specifics. For example, maintenance activity might cause a database restart and an attempt by the caching system to warm up by pulling data from the database. If the cache warmup failed, traffic could go directly to the database and overload it.
What can you Learn From the Outage?
Of course, Slack has a much larger user base than the average ITOps team or website administrator, but there are still lessons we can learn from this outage case study. Below, we’ll explore our three biggest takeaways from this incident.
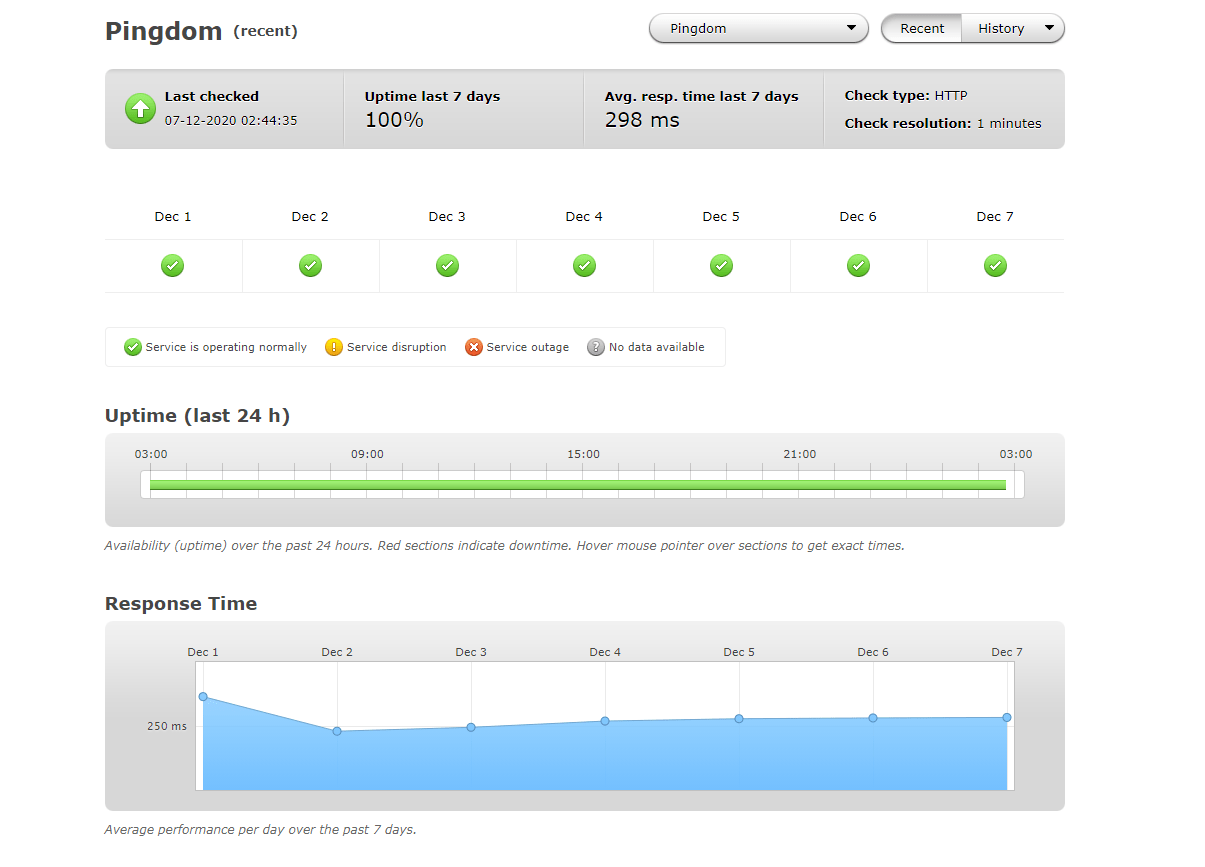
Takeaway #1: Have the right monitoring in place to truly identify ‘up’ versus ‘down’
One of the worst situations in ITOps and site reliability engineering (SRE) is when your users tell you about an issue, meaning they detected it before you did. Things will go wrong, so it is essential to have monitoring in place to you know when a system is unhealthy based on data, not just user reporting. Additionally, effective monitoring empowers teams to understand when corrective actions have a positive impact, like when Slack saw some improvements after their mitigation efforts.
ITSM maturity varies across teams and acceptable downtime influences the robustness of monitoring systems. Here are three tips that everyone, from solo operators to large enterprises, can use:
- Use transaction monitoring to test critical workflows. Transaction monitoring automatically tests website workflows. It notifies you when a critical workflow breaks so you can act (or trigger an automation) to resolve the issue
- Monitor end user experience with real user monitoring (RUM). If your users are experiencing errors, you should know about this without users opening reactive support tickets. RUM gives teams visibility into user experience and is a key component of effective application performance monitoring (APM)
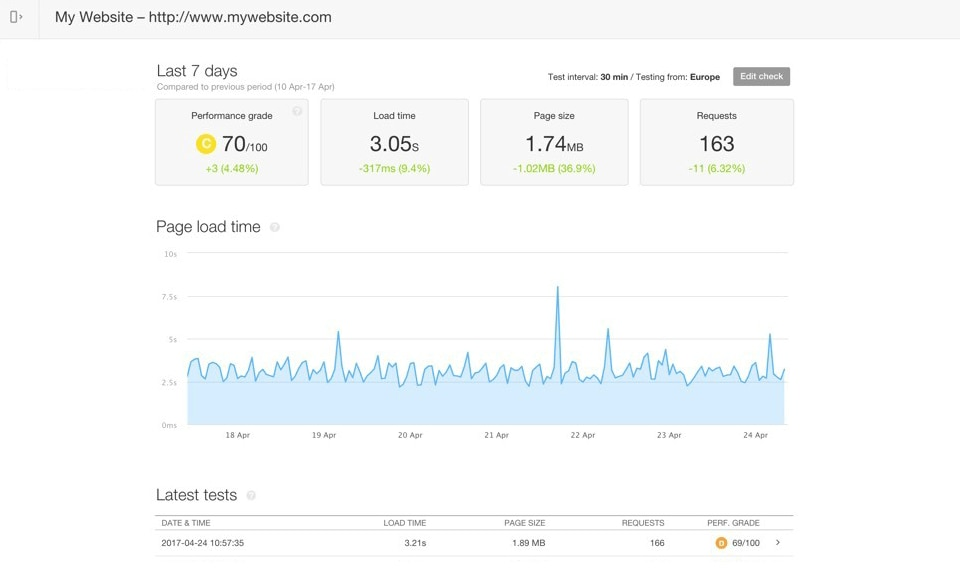
- Implement page speed monitoring to detect when your site’s performance degrades or becomes unusable. Depending on how you measure, metrics can indicate a site is ‘up’ and healthy even though it is effectively down for your users. For example, a server may respond to a ping, although pages take minutes to load. From a user perspective, extremely slow page load times are the same as an outage, and page speed monitoring helps you detect this problem early
Takeaway #2: Plan corrective actions and incident response before you have an outage
The mitigating actions that Slack implemented for the outage caused a smaller issue with their Events API and possibly with @mentions. When critical workloads go down, it is understandable that there will be some side effects from emergency mitigations. However, it is essential to ensure the tradeoffs are worth it.
In the chaotic frenzy of a crisis, engineers will do their best to resolve an issue, but it’s easy to develop tunnel vision and overlook unacceptable tradeoffs. This is where preparation and runbooks come in. Creating runbooks for possible outage scenarios allows you to create a logical series of triage and mitigation steps before the pressure of an outage forces quick action or reaction.
Takeaway #3: Control chaos by keeping users informed
Slack’s downturn caused a lot of noise on social media and generated confusion for affected users. Once those users realized what was going on, many people had questions about Slack. Answering each user individually is not scalable or efficient. Broadcasting status updates gives users a single source of truth for information and reduces the burden on the teams supporting and recovering the app.
Typically, a public status page effectively communicates site status. The key is to ensure your users know about it and that it’s regularly updated to maintain trust in the information. Additionally, an out-of-band notification method (such as a social media post or email blast) can point back to your status page, raising awareness and providing users with clarity in an otherwise chaotic situation.
How SolarWinds Pingdom can help improve your website monitoring
SolarWinds® Pingdom® is a simple, yet powerful simple website availability and performance monitoring platform designed to help IT and website administrators take a more proactive approach to incident response and improve site uptime. Teams can use Pingdom to monitor websites from multiple regions across the globe, focusing their operations on end-user experiences.
If you would like to take SolarWinds Pingdom for a test drive, sign up for a free trial today.

