Synthetic Monitoring

Simulate visitor interaction with your site to monitor the end user experience.

View Product Info

FEATURES

Simulate visitor interaction

Identify bottlenecks and speed up your website.

Learn More

Real User Monitoring

Enhance your site performance with data from actual site visitors

View Product Info

FEATURES

Real user insights in real time

Know how your site or web app is performing with real user insights

Learn More

Infrastructure Monitoring Powered by SolarWinds AppOptics

Instant visibility into servers, virtual hosts, and containerized environments

View Infrastructure Monitoring Info
Comprehensive set of turnkey infrastructure integrations

Including dozens of AWS and Azure services, container orchestrations like Docker and Kubernetes, and more 

Learn More

Application Performance Monitoring Powered by SolarWinds AppOptics

Comprehensive, full-stack visibility, and troubleshooting

View Application Performance Monitoring Info
Complete visibility into application issues

Pinpoint the root cause down to a poor-performing line of code

Learn More

Log Management and Analytics Powered by SolarWinds Loggly

Integrated, cost-effective, hosted, and scalable full-stack, multi-source log management

 View Log Management and Analytics Info
Collect, search, and analyze log data

Quickly jump into the relevant logs to accelerate troubleshooting

Learn More

Real User Monitoring

Gain visibility into how your end users are interacting with and experiencing your website or web app with scalable real user monitoring (RUM). This monitoring solution offers fast and accurate client-side problem identification and resolution.

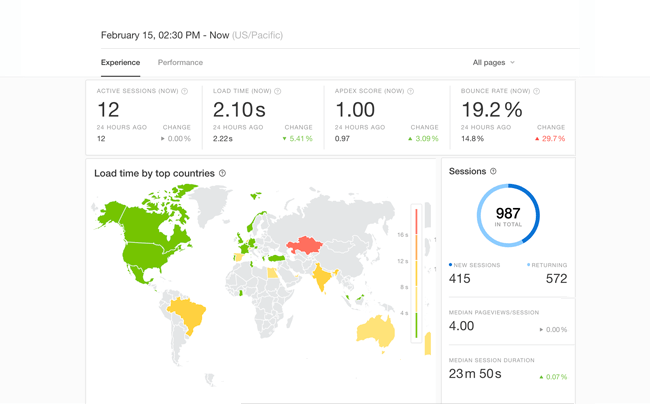
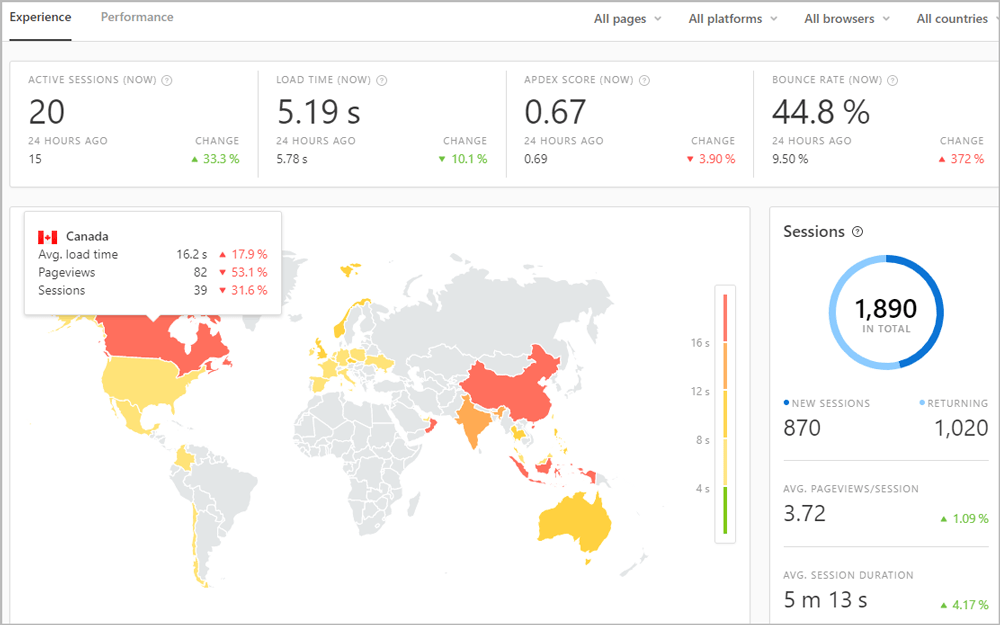
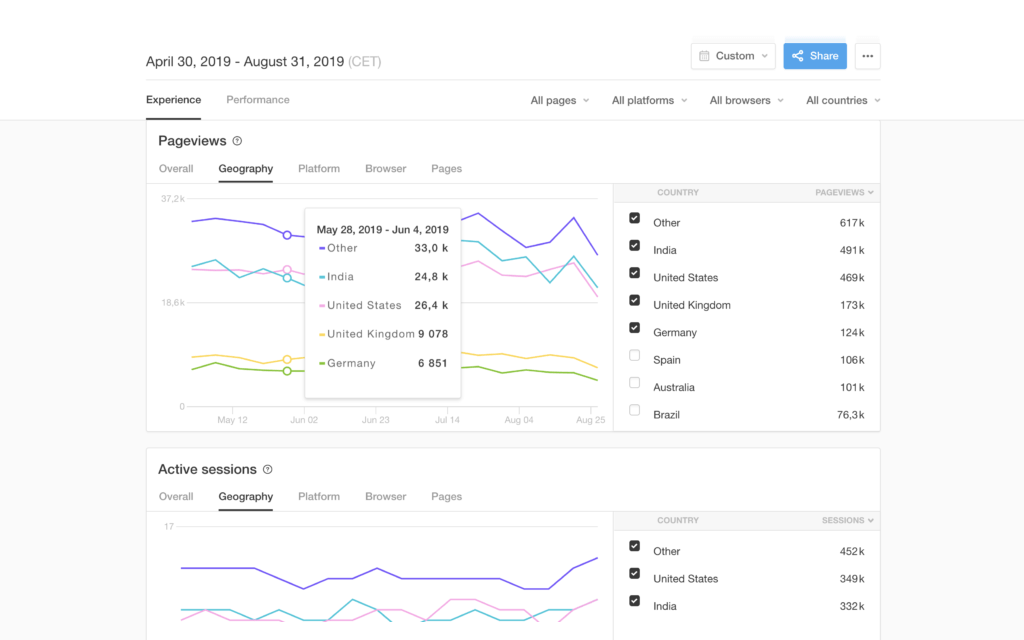
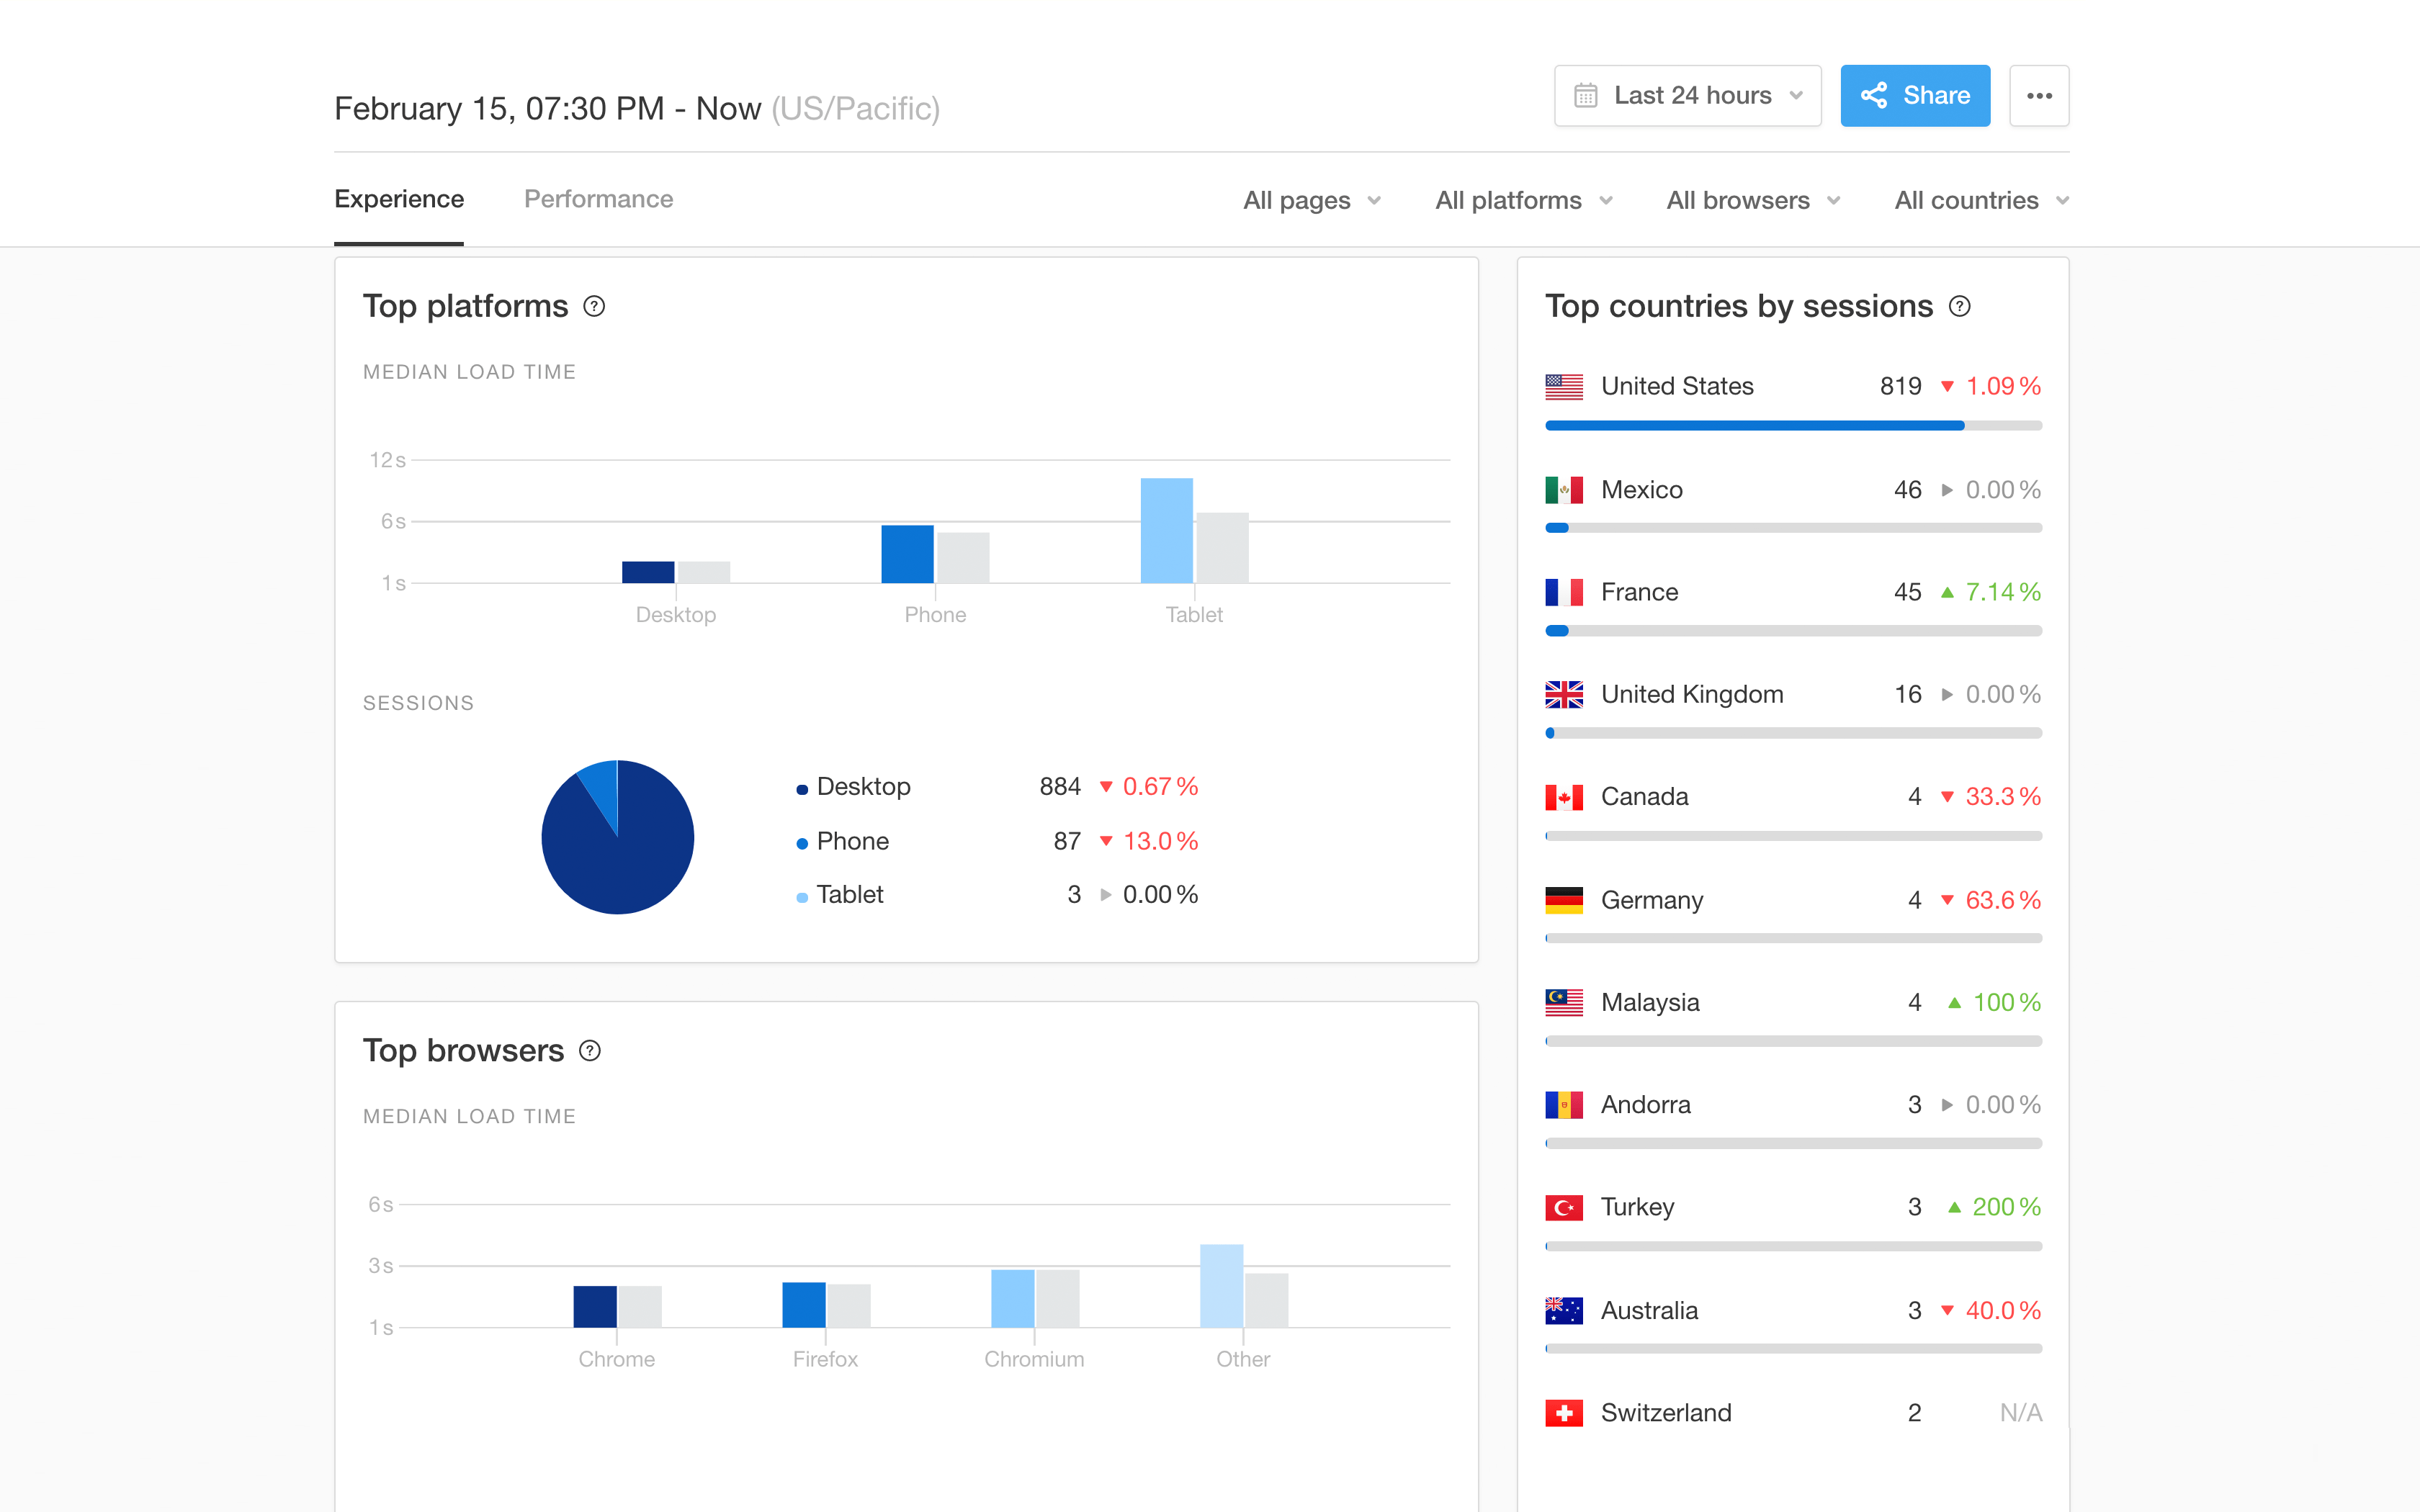
  • Visual geographic hot spots with live mapping
  • Insights into user behaviors and platforms
  • Granular visibility with advanced filtering
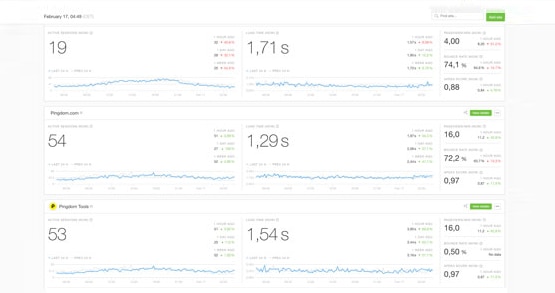
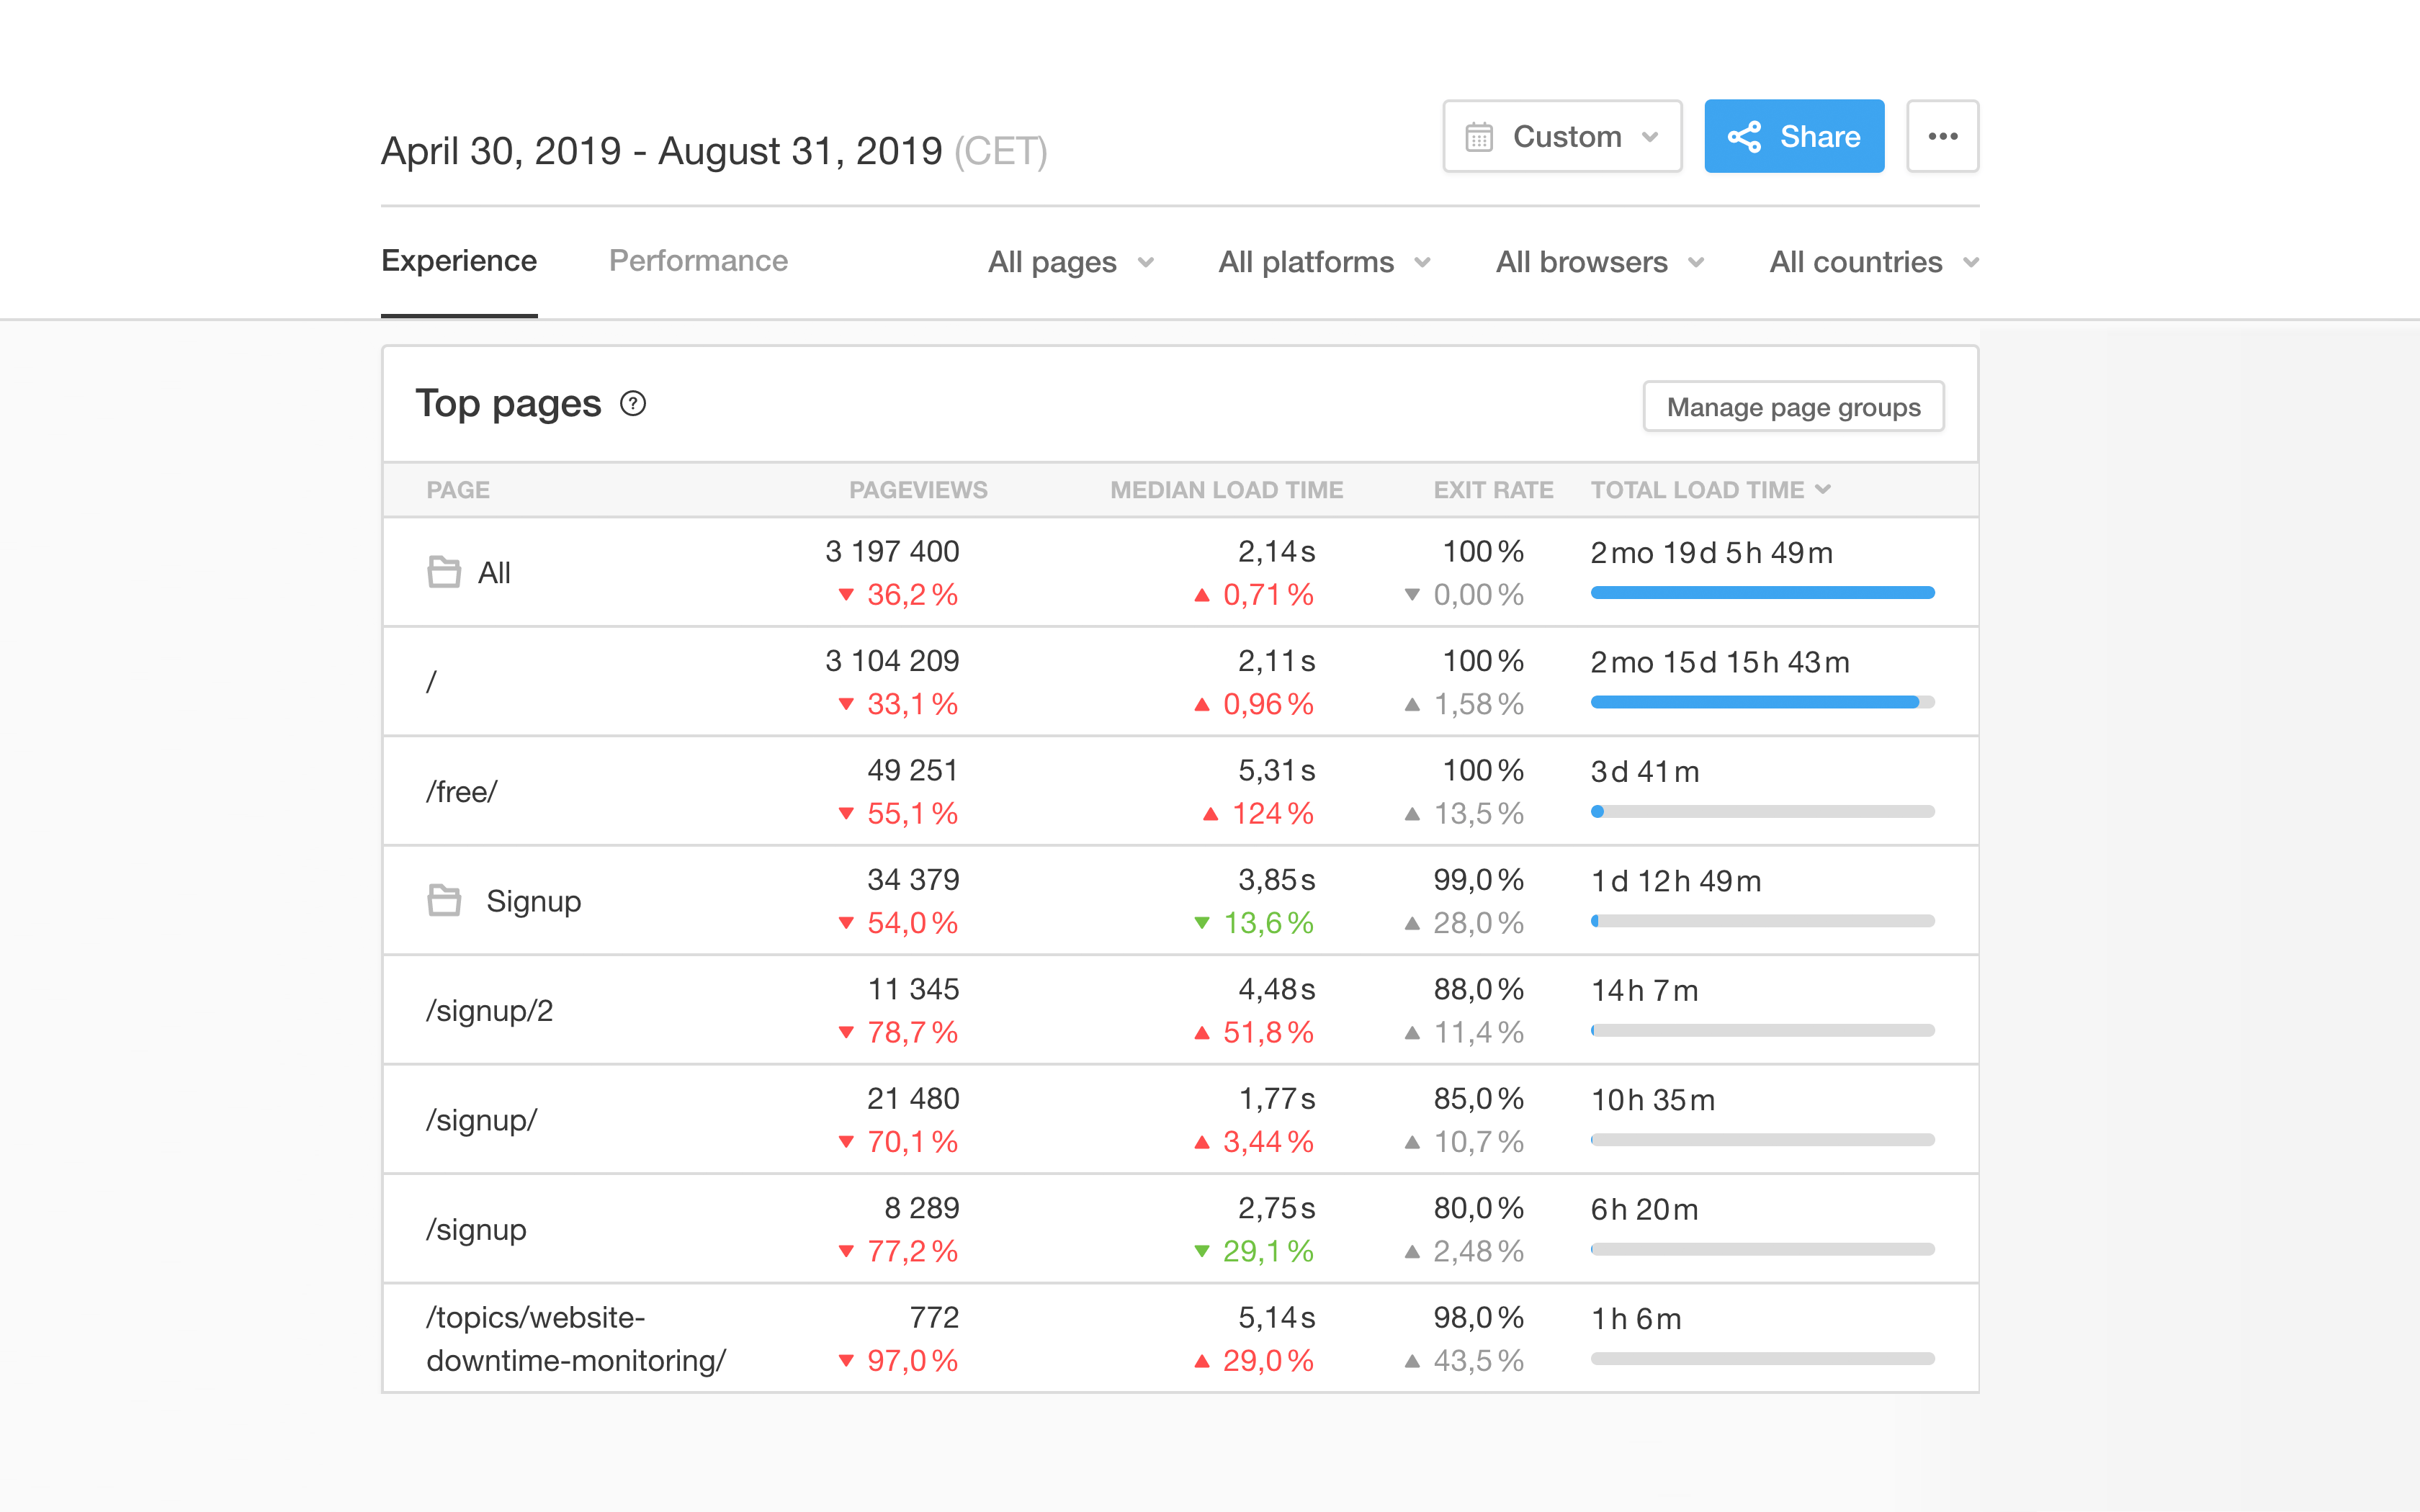
  • Summary of key performance and usage metrics, now and over time
  • Easily sharable user insight reports
Starts at $10 per month | Calculate Your Price
START FREE TRIAL

First 30 days free
Trial includes Synthetics & RUM

Get Started Quickly and Easily

SolarWinds Pingdom RUM is lightweight, and you can deploy it with just a snippet of code. Start viewing live visitor insights within seconds of adding the tag to your site.

Know Your Users and Their Digital Behavior

Identify how and where your customers access your website. Then filter by browser, device, and platform to understand their behavior.

Optimize Your Customers’ Digital Experience

Discover how and where site performance issues affect the end-user experience to reduce troubleshooting time. View performance trends over time and make data-driven decisions to improve the end-user experience.

Simple and Scalable Monitoring

Real user monitoring (RUM) is an event-based solution, so you can monitor millions of pageviews without compromising the fidelity of your historical data or breaking the bank.

Know Your Users and Their Digital Behavior

Understand who is impacted by outages and poor user experiences. Find out if there’s a trend across regions or devices and adapt your messaging or website configuration accordingly. You can also drill into different time periods to see how performance has changed over time and how your website updates have impacted performance.

Identify Bottlenecks With Advanced Filtering

How your visitors experience your site can differ depending on the browser, device, and platform they use. Identify how your most valued customers access your website and make informed optimizations to deliver great performance to those who matter most. Get insight into performance issues on your website when you filter real user data by browser, device, and geographic location.

Troubleshoot Performance Issues From the End-User Perspective

By monitoring the health and performance of your website, you’ll always be the first to know when an incident occurs. With Pingdom real user monitoring, you can set performance levels for what you consider satisfactory to help ensure your customers get the site experience they deserve. Then you can analyze performance metrics like Apdex score—a generally accepted customer satisfaction score—or customize your own score. You can also look at metrics such as load time (to see whether you’re achieving the SLAs set by your organization or your customers) or time to first byte (to discover when users start seeing specific elements on a page).

Share and Customize Reports on Website Performance

Pingdom real user monitoring allows you to filter and share reports with customers or key stakeholders. These reports can be filtered by the end user, so whoever you share it with can edit their own view. The top-level dashboards give you and your team a quick summary of how multiple websites or applications are performing before you dive deeper. The page-level metrics make it easy to focus on the most important pages on your site, whether they’re checkout pages, signup pages, or your blog. Our page grouping feature also gives you the ability to consolidate performance metrics for a group of related pages and share high-level summaries.

Discover and Compare Usage Metrics Over Time

Identify website improvements, compare year-over-year data, and inform design decisions with usage metrics like top visited pages, top platforms, top browsers, active sessions, and bounce rates. Top visited pages can show you where customers are spending the most time, and top platforms can help you figure out whether you should spend your time optimizing your website for mobile devices. Top browsers can help you discover whether your website is functioning best on Chrome, Firefox, or another browser. These metrics and more can help you discover the most important parts of your website to monitor with Pingdom synthetic monitoring.

Start Monitoring Free for 30 Days

Complete monitoring combines real user monitoring and synthetic monitoring for ultimate visibility and enhanced troubleshooting. Start monitoring and get your first 30 days free.

Start monitoring for free