


Website Monitoring Tools
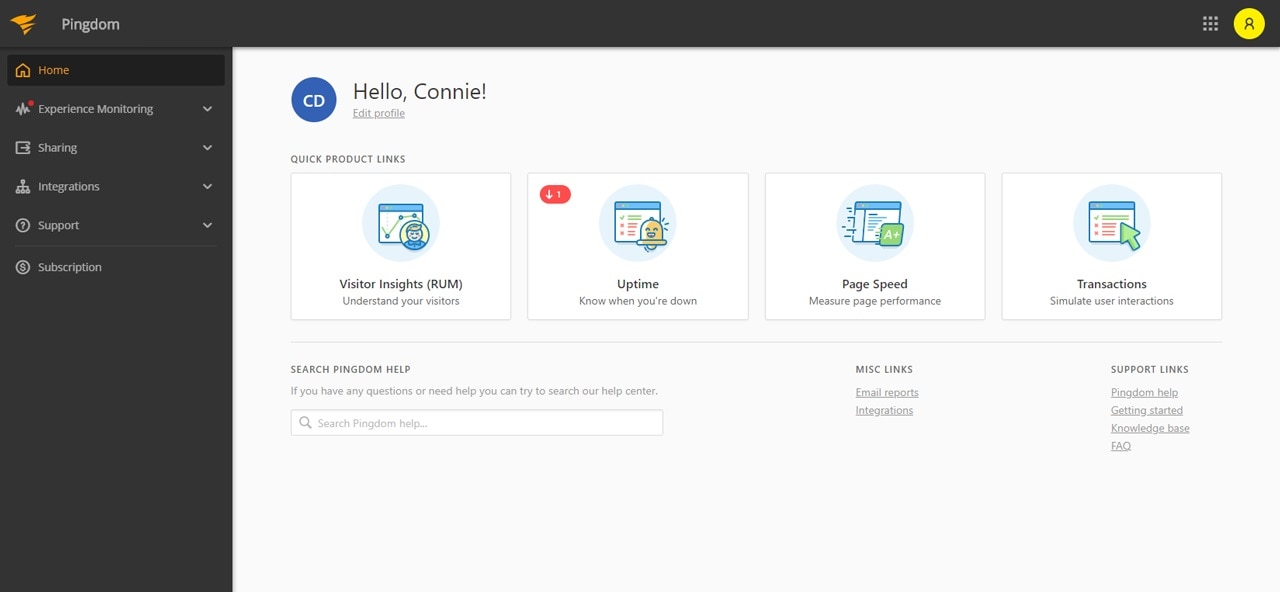
SolarWinds® Pingdom® offers a single-platform solution to help monitor the availability and performance of your websites, servers, and web applications.
Be the First to Know When Your Site Is Down
Test the availability of your crucial websites, applications, and services as often as every minute with our network of 100+ servers worldwide.
When an incident happens, Pingdom immediately alerts you with all the information you need to resolve the issue quickly and confidently. Pingdom monitors much more than just whether your website is available; it sends you alerts about error messages, HTTP status, content changes, and more. When your website becomes available again, our system will notify you all is well.
Learn more about uptime monitoring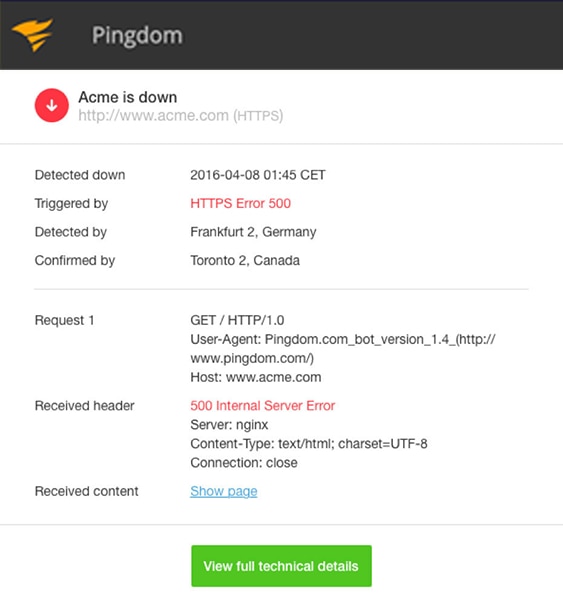
You’ll be in good company


User Experience Monitoring From Real Visitor Data
Optimize your website’s performance based on data from actual site visitors with real user monitoring (RUM). Troubleshoot performance issues from the end-user’s perspective and identify bottlenecks with advanced filtering.

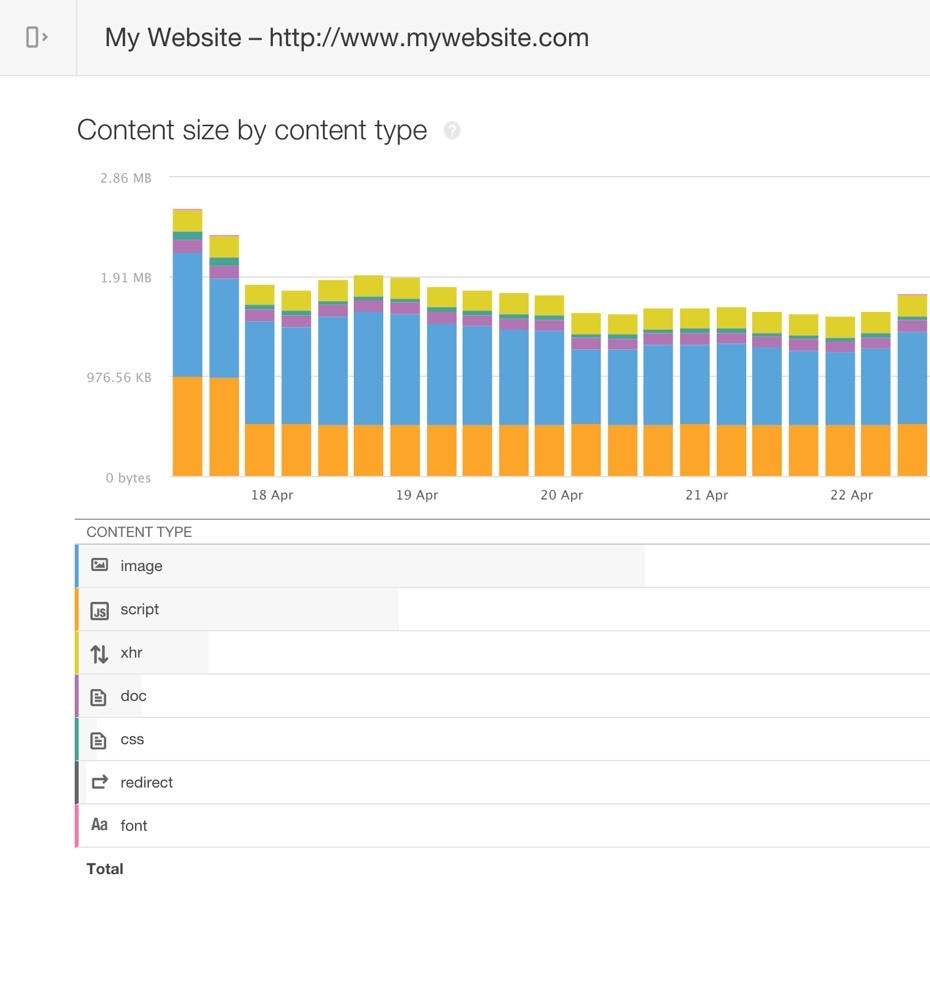
Everyone Loves a Fast Website
The page speed monitoring Pingdom offers helps you analyze the load speed of your webpages and shows you how to make them faster. Identify which elements of your webpage are fast, slow, or too big; which best practices you’re not following; and whether the changes you’ve made have had the intended effect. Track and analyze page speed over time to find bottlenecks affecting your customers’ end-user experience.
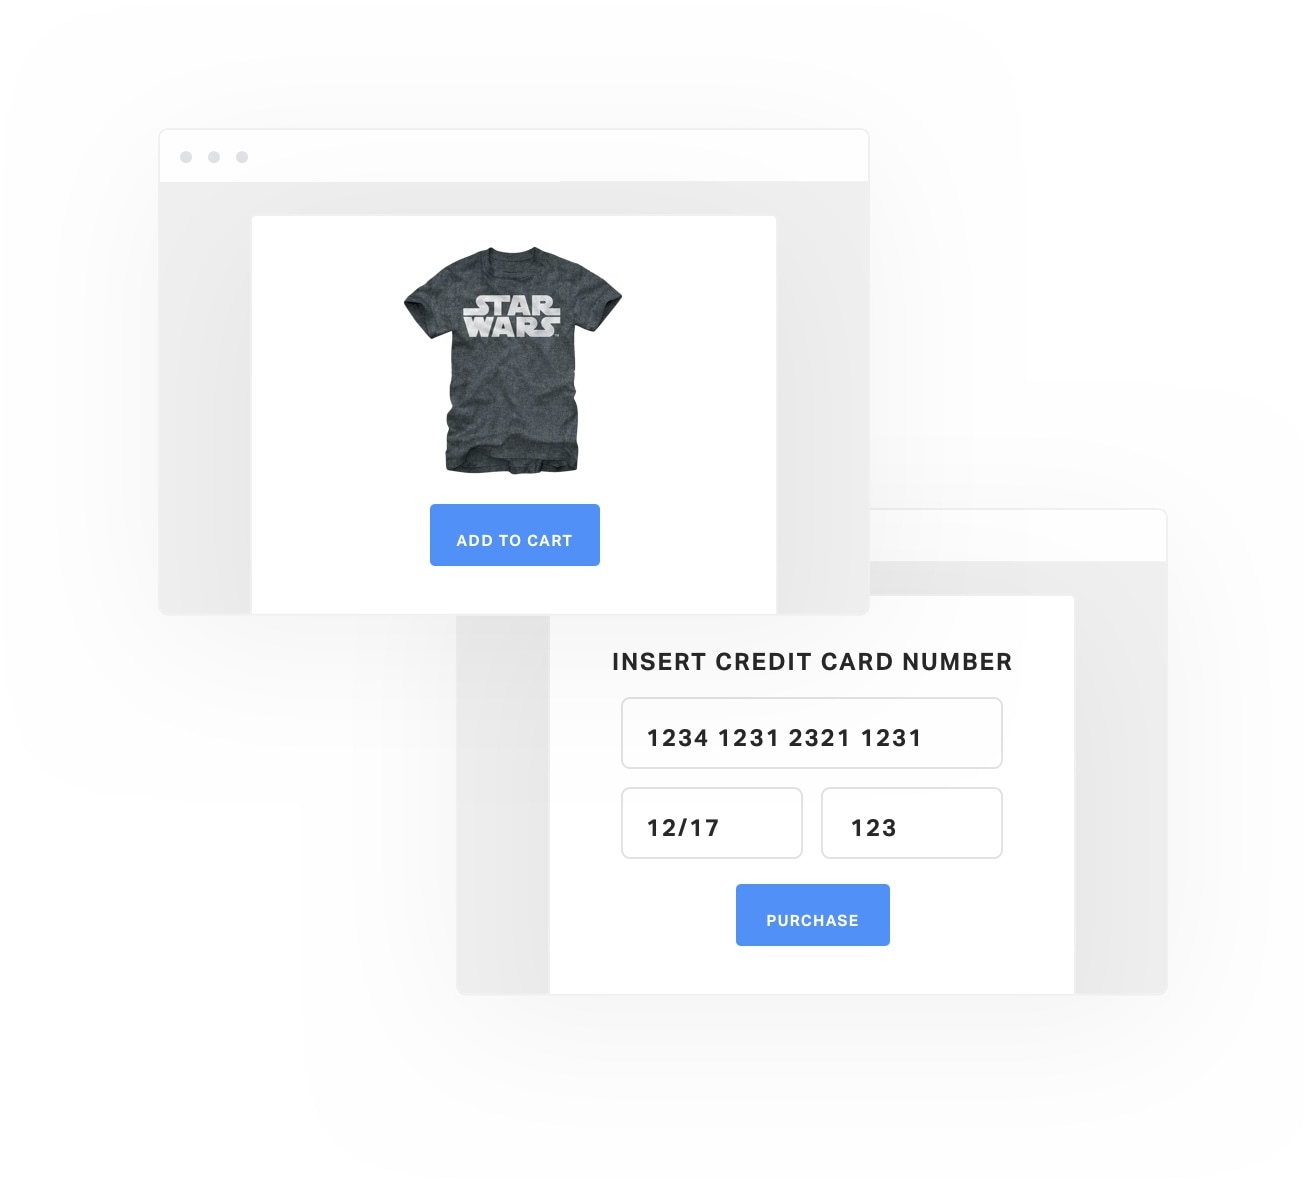
Identify Broken and Slow Website Interactions
The synthetic monitoring feature in Pingdom includes transaction monitoring. Transaction tests simulate site interactions by reproducing them at set intervals in a real Chrome browser as if a visitor was experiencing them. If a step fails in your business-critical transactions, Pingdom can send you an alert and help you act before your customers notice.
Monitor simple or highly complex transactions, such as new user registrations, user logins, searches, shopping cart checkouts, URL hijacking, and more with a simple setup. Synthetic transaction monitoring is essential to make sure your website is available and functioning as expected.
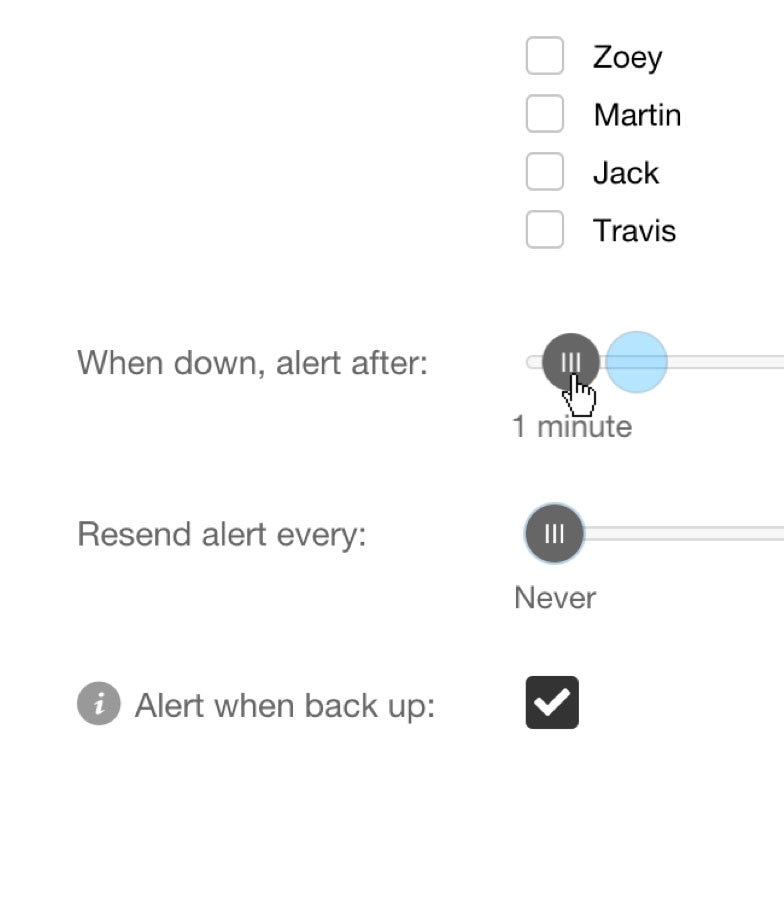
Immediate and Reliable Alerting
Pingdom was made to directly alert users of any downtime occurring on their servers and websites. With Pingdom, you can select when you wish to be alerted about an outage. If there’s an issue with your critical services, you want to get alerted immediately. You can also set an alert to notify you after one minute, two minutes, or after another interval of your choice. Additionally, Pingdom can resend alerts after a chosen interval up to four times after the initial alert.
Try it free for 30 days
Start monitoring your website's availability
START 30-DAY FREE TRIALGet started now and you can cancel any time.